Forum Discussion
 Nimbostratus
Using Journeys to migration to rSeries
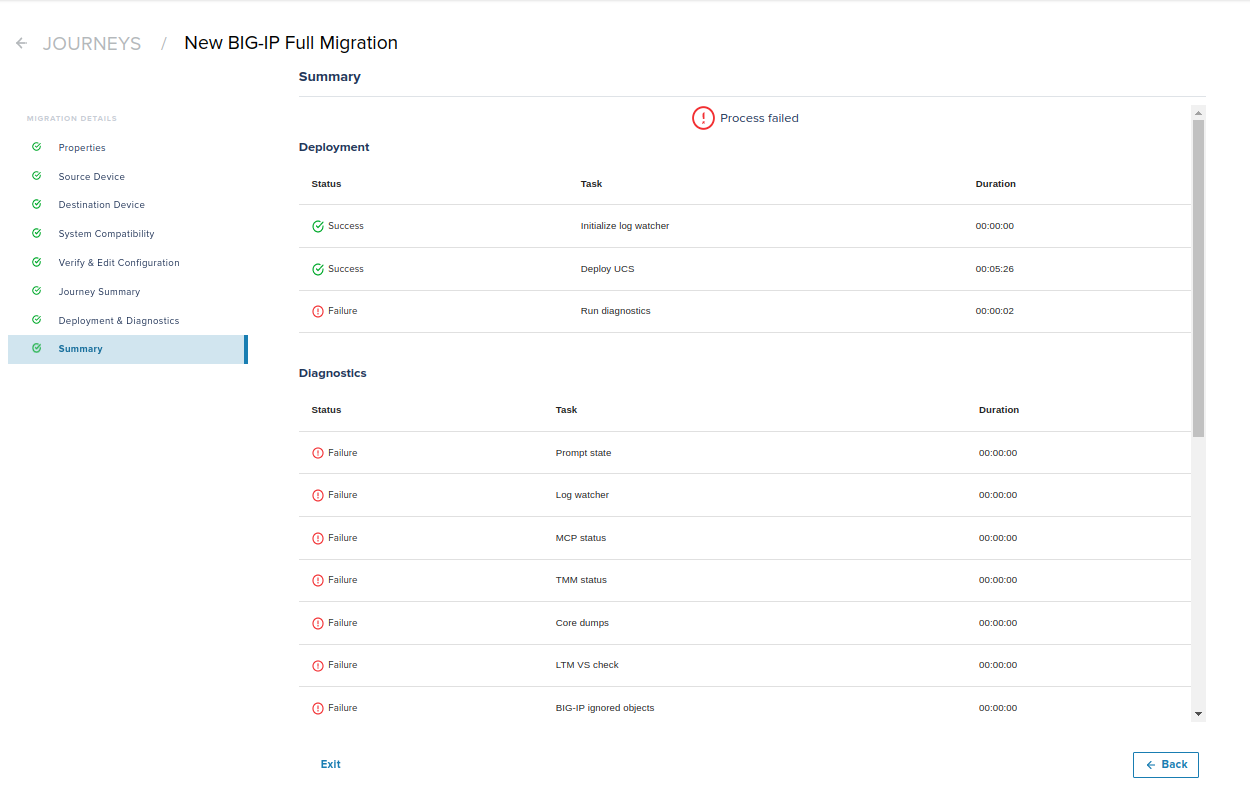
I plan to use Journeys to migrate i7500 15.1.x to r5900 15.1.x. I managed to deploy the .ucs file to the new r5900 series (with a different mgmt IP address) successfully.
The "Deployment UCS" is successful but all the post migration diagnostics failed. I would like to run through all of those diagnostics to discover any potential migration errors or mistakes.
I do not know where to check the Journeys logs or the rSeries log to figure out why the diagnostics tasks failed. Can anyone help me here? Thanks.
Leo
Hi leo_song,
Rseries has the same Tmos SOS at the tenants Level, so you can find any error in the /var/log/ltm, off course if you have other modules you have to review the specific folder for example for asm /var/log/asm.
use commands like
tmsh load sys config verify
To validate the load config and
tailf /var/log/ltm
to review the logs in real time.
hope it´s work.
3 Replies
Hi leo_song,
Rseries has the same Tmos SOS at the tenants Level, so you can find any error in the /var/log/ltm, off course if you have other modules you have to review the specific folder for example for asm /var/log/asm.
use commands like
tmsh load sys config verify
To validate the load config and
tailf /var/log/ltm
to review the logs in real time.
hope it´s work.
 leo_song
Thanks, somehow it worked at the primary unit and failed at the secondary unit. But it's good for me and I can move forward.
Leo
Hi Leo_Song,
You can see the r Series hardware level logs as follows:
The system logs events to the appliance.log file located in the log/host directory
appliance-1# file list path log/host
appliance-1# file show log/host/boot.log
appliance-1# file tail -f log/host/appliance.logView health information about system components.
show system health components component [ appliance | drive-slot-1 | drive-slot-2 | fantray | lcd | psu-1 | psu-2 ] [ firmware | hardware | services ] <hardware-identifier>
The available components might vary depending on hardware model.This example shows the high-level hardware state for the fan tray:
appliance-1# show system health components component fantray hardware state
KEY NAME HEALTH SEVERITY
--------------------------------------------------------
appliance/hardware/fantray Fan Tray ok info
This example shows a power supply unit (PSU) redundancy fault:
appliance-1# show system alarms | tab
ID RESOURCE SEVERITY TEXT TIME CREATED
–––––––––––––––––––––––––––––––––––––––––––––––––––––––––––––––––––––––––––––––––––––––––––––––––––––––––––––––-
65793 psu-1 ERROR PSU fault detected 2022-06-01-11:11:11.999825828 UTC
Generate a QKView file.
system diagnostics qkview capture exclude-cores { false | true } filename <filename> maxcoresize <size> maxfilesize <size> timeout <time>Check the status of the QKView generation process.
system diagnostics qkview status
A summary similar to this example displays:
appliance-1(config)# system diagnostics qkview status
result {"Busy":true,"Percent":12,"Status":"collecting","Message":"Collecting Data","Filename":"client-qkview"}resultint 0
For a very detail rSeries Diagnostics kindly refer below
https://clouddocs.f5.com/training/community/rseries-training/html/rseries_diagnostics.html
Hope that helps to the other viewers as well
🙏

Help guide the future of your DevCentral Community!
What tools do you use to collaborate? (1min - anonymous)

Recent Discussions
Related Content
* Getting Started on DevCentral
* Community Guidelines
* Community Terms of Use / EULA
* Community Ranking Explained
* Community Resources
* Contact the DevCentral Team
* Update MFA on account.f5.com