deployment
4251 Topics
F5 LTM migration from iSeries to rSeries
Hello, I am trying to migrate LTM from iSeries to rSeries using the ucs file from the iSeries. The UCS file does not have encryption enabled. Getting the below error during the migration Command given was on rSeries tmsh load sys ucs source_config.ucs no-license platform-migrate Error 0x1071769 occurred: 01071769:3: Decryption of the field (value) for object (configsync.password) failed while loading configuration that is encrypted with a different master key. Any help is appreciated Thanks62Views0likes4Comments
F5 Distributed Cloud Granular Load Balancer Configuration Control
F5XC API Arbitration is a lightweight Flask proxy that adds more granular control to F5 Distributed Cloud load balancer changes. It allows developers, CI/CD pipelines, or automation tools to request approved updates like route changes, but deny security sensitive policies like WAF settings. The proxy mirrors the F5XC API structure so existing automation can adopt it with minimal retooling.27Views0likes0CommentsDeploying the F5 AI Security Certified OpenShift Operator: A Validated Playbook
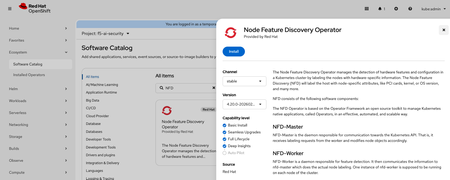
Introduction As enterprises race to deploy Large Language Models (LLMs) in production, securing AI workloads has become as critical as securing traditional applications. The F5 AI Security Operator installs two products on your cluster — F5 AI Guardrails and F5 AI Red Team — both powered by CalypsoAI. Together they provide inline prompt/response scanning, policy enforcement, and adversarial red-team testing, all running natively on your own OpenShift cluster. This article is a validated deployment runbook for F5 AI Security on OpenShift (version 4.20.14) with NVIDIA GPU nodes. It is based on the official Red Hat Operator installation baseline, in a real lab deployment on a 3×A40 GPU cluster. If you follow these steps in order, you will end up with a fully functional AI Security stack, avoiding the most common pitfalls along the way. What Gets Deployed F5 AI Security consists of four main components, each running in its own OpenShift namespace: Component Namespace Role Moderator + PostgreSQL cai-moderator Web UI, API gateway, policy management, and backing database Prefect Server + Worker prefect Workflow orchestration for scans and red-team runs AI Guardrails Scanner cai-scanner Inline scanning against your OpenAI-compatible LLM endpoint AI Red Team Worker cai-redteam GPU-backed adversarial testing; reports results to Moderator via Prefect The Moderator is CPU-only. The Scanner and Red Team Worker can leverage GPUs depending on the policies and models you configure. Infrastructure Requirements Before you begin, verify your cluster meets these minimums: CPU / Control Node 16 vCPUs, 32 GiB RAM, x86_64, 100 GiB persistent storage Worker Nodes (per GPU-enabled component) 4 vCPUs, 16 GiB RAM (32 GiB recommended for Red Team), 100 GiB storage GPU Nodes AI Guardrails: CUDA-compatible GPU, minimum 24 GB VRAM, 100 GiB storage AI Red Team: CUDA-compatible GPU, minimum 48 GB VRAM, 200 GiB storage GPU must NOT be shared with other workloads Verify your cluster: # Check nodes oc get nodes -o wide # Check GPU allocatable resources oc get node -o jsonpath='{range .items[*]}{.metadata.name}{"\t"}{.status.allocatable.nvidia\.com/gpu}{"\n"}{end}' # Check available storage classes oc get storageclass NAME PROVISIONER RECLAIMPOLICY VOLUMEBINDINGMODE ALLOWVOLUMEEXPANSION AGE lvms-vg1 (default) topolvm.io Delete WaitForFirstConsumer true 15d Step 1 — Install Prerequisites 1.1 Node Feature Discovery (NFD) Operator NFD labels your nodes with hardware capabilities, which NVIDIA GPU Operator relies on to target the right nodes. OpenShift Console → Ecosystem → Software Catalog → Search Node Feature Discovery Operator → Install After installation: Installed Operators → Node Feature Discovery → Create NodeFeatureDiscovery → Accept defaults Verify: oc get pods -n openshift-nfd oc get node --show-labels | grep feature.node.kubernetes.io || true 1.2 NVIDIA GPU Operator OpenShift Console → Ecosystem → Software Catalog → Search GPU Operator → Install After installation: Installed Operators → NVIDIA GPU Operator → Create ClusterPolicy → Accept defaults Verify: oc get pods -n nvidia-gpu-operator oc describe node <gpu-node> | grep -i nvidia nvidia-smi</gpu-node> Step 2 — Install F5 AI Security Operator Prerequisites: You will need registry credentials and a valid license from the F5 AI Security team before proceeding. Contact F5 Sales: https://www.f5.com/products/get-f5 2.1 Create the Namespace and Pull Secret export DOCKER_USERNAME='<registry-username>' export DOCKER_PASSWORD='<registry-password>' export DOCKER_EMAIL='<your-email>' oc new-project f5-ai-sec oc create secret docker-registry regcred \ -n f5-ai-sec \ --docker-username=$DOCKER_USERNAME \ --docker-password=$DOCKER_PASSWORD \ --docker-email=$DOCKER_EMAIL</your-email></registry-password></registry-username> 2.2 Install from OperatorHub OpenShift Console → Ecosystem → Software Catalog → Search F5 AI Security Operator → Install into namespace f5-ai-sec Verify your F5 AI Security Operator: # Verify the controller-manager pod is Running oc -n f5-ai-sec get pods # NAME READY STATUS RESTARTS AGE # controller-manager-6f784bd96d-z6sbh 1/1 Running 1 43s # Verify the CSV reached Succeeded phase oc -n f5-ai-sec get csv # NAME DISPLAY VERSION PHASE # f5-ai-security-operator.v0.4.3 F5 Ai Security Operator 0.4.3 Succeeded # Verify the CRD is registered oc -n f5-ai-sec get crd | grep ai.security.f5.com # securityoperators.ai.security.f5.com 2.3 Deploy the SecurityOperator Custom Resource After installation: Installed Operators → F5 AI Security Operator → Create SecurityOperator Choose YAML and copy the below Custom Resource Template in there, changing select values to match your installation. apiVersion: ai.security.f5.com/v1alpha1 kind: SecurityOperator metadata: name: security-operator-demo namespace: f5-ai-sec spec: registryAuth: existingSecret: "regcred" # Internal PostgreSQL — convenient for labs, not recommended for production postgresql: enabled: true values: postgresql: auth: password: "pass" jobManager: enabled: true moderator: enabled: true values: env: CAI_MODERATOR_BASE_URL: https://<your-hostname> secrets: CAI_MODERATOR_DB_ADMIN_PASSWORD: "pass" CAI_MODERATOR_DEFAULT_LICENSE: "<valid_license_from_f5>" scanner: enabled: true redTeam: enabled: true</valid_license_from_f5></your-hostname> Key values to customize: Field What to set CAI_MODERATOR_BASE_URL Your cluster's public hostname for the UI (e.g., https://aisec.apps.mycluster.example.com ) CAI_MODERATOR_DEFAULT_LICENSE License string provided by F5 CAI_MODERATOR_DB_ADMIN_PASSWORD DB password — must match the value set in the PostgreSQL block For external PostgreSQL (recommended for production), replace the postgresql block with: moderator: values: env: CAI_MODERATOR_DB_HOST: <my-external-db-hostname> secrets: CAI_MODERATOR_DB_ADMIN_PASSWORD: <my-external-db-password></my-external-db-password></my-external-db-hostname> Verify your F5 AI Security Operator: oc -n f5-ai-sec get securityoperator oc -n f5-ai-sec get securityoperator security-operator-demo -o yaml | sed -n '/status:/,$p' Step 3 — Required OpenShift Configuration This is where most deployments hit problems. OpenShift's default restricted Security Context Constraint (SCC) blocks these containers from running. You must explicitly grant anyuid to each service account. 3.1 Apply SCC Policies oc adm policy add-scc-to-user anyuid -z cai-moderator-sa -n cai-moderator oc adm policy add-scc-to-user anyuid -z default -n cai-moderator oc adm policy add-scc-to-user anyuid -z default -n prefect oc adm policy add-scc-to-user anyuid -z prefect-server -n prefect oc adm policy add-scc-to-user anyuid -z prefect-worker -n prefect oc adm policy add-scc-to-user anyuid -z cai-scanner -n cai-scanner oc adm policy add-scc-to-user anyuid -z cai-redteam-worker -n cai-redteam 3.2 Force PostgreSQL to Restart (if Stuck at 0/1) If PostgreSQL was stuck before the SCC was applied, bounce it manually: oc -n cai-moderator scale sts/cai-moderator-postgres-cai-postgresql --replicas=0 oc -n cai-moderator scale sts/cai-moderator-postgres-cai-postgresql --replicas=1 3.3 Restart All Components oc -n cai-moderator rollout restart deploy oc -n prefect rollout restart deploy oc -n cai-scanner rollout restart deploy oc -n cai-redteam rollout restart deploy 3.4 Verify ➜ oc -n cai-moderator get statefulset NAME READY AGE cai-moderator-postgres-cai-postgresql 1/1 3d4h ➜ oc -n cai-moderator get pods | grep postgres cai-moderator-postgres-cai-postgresql-0 1/1 Running 0 3d4h ➜ oc -n cai-moderator get pods | grep cai-moderator cai-moderator-75c47fc9db-sl8t2 1/1 Running 0 3d4h cai-moderator-postgres-cai-postgresql-0 1/1 Running 0 3d4h ➜ oc -n cai-moderator get svc NAME TYPE CLUSTER-IP EXTERNAL-IP PORT(S) AGE cai-moderator ClusterIP 172.30.123.197 <none> 5500/TCP,8080/TCP 3d4h cai-moderator-headless ClusterIP None <none> 8080/TCP 3d4h cai-moderator-postgres-postgresql ClusterIP None <none> 5432/TCP 3d4h ➜ oc -n cai-moderator get endpoints Warning: v1 Endpoints is deprecated in v1.33+; use discovery.k8s.io/v1 EndpointSlice NAME ENDPOINTS AGE cai-moderator 10.130.0.139:8080,10.130.0.139:5500 3d4h cai-moderator-headless 10.130.0.139:8080 3d4h cai-moderator-postgres-postgresql 10.128.0.177:5432 3d4h</none></none></none> Step 4 — Create OpenShift Routes (Required for UI Access) The Moderator exposes two ports that must be routed separately: port 5500 for the UI and port 8080 for the /auth path. Skipping the auth route is the most common cause of the blank/black page issue. # UI route oc -n cai-moderator create route edge cai-moderator-ui \ --service=cai-moderator \ --port=5500 \ --hostname=<your-hostname> \ --path=/ # Auth route — required, or the UI will render blank oc -n cai-moderator create route edge cai-moderator-auth \ --service=cai-moderator \ --port=8080 \ --hostname=<your-hostname> \ --path=/auth</your-hostname></your-hostname> Verify all pods are running: oc get pods -n cai-moderator oc get pods -n cai-scanner oc get pods -n cai-redteam oc get pods -n prefect Access the UI Open https:// in a browser. Log in with the default credentials: admin / pass Log in and update the admin email address immediately. You should be able to log in successfully and see the Guardrails dashboard. Step 5 — Grant Prefect Worker Cluster-scope RBAC The Prefect worker watches Kubernetes Pods and Jobs at cluster scope to monitor scan and red-team workflow execution. Without this RBAC, prefect-worker fills its logs with 403 Forbidden errors. The Guardrails UI still loads, but scheduled workflows and Red Team runs will fail silently. # ClusterRole: allow prefect-worker to list/watch pods, jobs, and events cluster-wide oc apply -f - <<'YAML' apiVersion: rbac.authorization.k8s.io/v1 kind: ClusterRole metadata: name: prefect-worker-watch-cluster rules: - apiGroups: ["batch"] resources: ["jobs"] verbs: ["get","list","watch"] - apiGroups: [""] resources: ["pods","pods/log","events"] verbs: ["get","list","watch"] YAML # ClusterRoleBinding: bind to the prefect-worker ServiceAccount oc apply -f - <<'YAML' apiVersion: rbac.authorization.k8s.io/v1 kind: ClusterRoleBinding metadata: name: prefect-worker-watch-cluster subjects: - kind: ServiceAccount name: prefect-worker namespace: prefect roleRef: apiGroup: rbac.authorization.k8s.io kind: ClusterRole name: prefect-worker-watch-cluster YAML # Restart to pick up the new permissions oc -n prefect rollout restart deploy/prefect-worker Verify RBAC errors are gone: oc -n prefect logs deploy/prefect-worker --tail=200 \ | egrep -i 'forbidden|rbac|permission|denied' \ || echo "OK: no RBAC errors detected" oc get clusterrolebinding prefect-worker-watch-cluster LlamaStack Integration F5 AI Security works alongside any OpenAI-compatible LLM inference endpoint. In our lab we pair it with LlamaStack running a quantized Llama 3.2 model on the same OpenShift cluster — F5 AI Guardrails then scans every prompt and response inline before it reaches your application. A dedicated follow-up post will walk through the full LlamaStack deployment and end-to-end integration in detail. Stay tuned. Summary Deploying F5 AI Security on OpenShift is straightforward once you know the OpenShift-specific friction points: SCC policies, the dual-route requirement, and the Prefect cluster-scope RBAC. Following this runbook in sequence — prerequisites, operator install, SCC grants, routes, Prefect RBAC — gets you to a fully operational AI guardrailing stack in a single pass. If you run into anything not covered here, drop a comment below. Tested on: OpenShift 4.20.14 · F5 AI Security Operator v0.4.3 · NVIDIA A40 GPUs · LlamaStack with Llama-3.2-1B-Instruct-quantized.w8a8 Additional Resources F5 AI Security Operator — Red Hat Catalog1.3KViews2likes1CommentObserving F5 BIG-IP CNE CNFs - V2 Metrics Aggregation walkthrough
Introduction Cloud-native distribution solves scale and resilience, but it fragments visibility. When TMM pods run across multiple Kubernetes nodes, logs and metrics scatter with them. The observer pod exists to pull that telemetry back into a single, coherent view. In a CNF deployment, multiple TMM pods run across Kubernetes nodes, each handling separate traffic slices. A coherent view of the entire dataplane requires aggregating those per-pod statistics. CNFs generate stats at high frequency across all TMM pods. Without aggregation, per-pod metric streams multiply quickly and do not compose cleanly into useful dashboard or alerting data. if you upgraded recently to CNF2.2+ you may have encountered new metrics behavior where, that's what we are covering here how V2 metrics change the metric collection and troubleshooting behavior. TODA Architecture: Four Components TODA (Telemetry, Observability, Diagnostics, and Analytics) is the stats collection and aggregation layer for CNFs. The distributed model has four roles: Component Description TMM Scraper Sidecar container in each TMM pod. Replaces tmstatsd. Serves metrics from tmctl over a gRPC response stream when requested by a Receiver. Receiver Runs as a StatefulSet. Scrapes metrics from assigned TMM Scrapers, persists them, and forwards to the Observer over gRPC with mutual TLS (mTLS). Handles metrics from terminated TMM pods so cumulative data is not lost mid-scrape. Observer Runs as a StatefulSet. The aggregation engine. Pulls from Receivers, aggregates metrics across all TMMs per table, and exports to the OTEL collector. Emits internal telemetry covering gRPC call metrics, aggregation performance, and storage state. Operator Runs as a Deployment. Orchestrates lifecycle: discovers TMM Scrapers, Receivers, and Observers; load-balances TMMs across Receivers; applies aggregation mode and collection interval settings via a ConfigMap. V1 vs. V2 CNF Metrics Choose before deploying. V1 and V2 use incompatible metric naming in Prometheus, so PromQL queries written for one will not work on the other. V1 (legacy): tmstatsd runs in each TMM pod and streams metrics directly to OTEL with no aggregation. Metric names look like: virtual_server_stat/spk-app-1-spk-app-tcp-8050-f5ing-testapp-virtual-server/clientside.bytes_out Each metric carries a tmmID attribute identifying the source pod. Six TMM pods means six separate data streams for the same virtual server. Dashboards scale poorly. V2 (current): The Receiver and Observer aggregate before export to OTEL. The equivalent metric: f5.virtual_server.clientside.received.bytes Attributes include f5.virtual_server.name, k8s.namespace.name, and observer.job.mode: aggregated. One metric, unified across all TMMs, with naming aligned to OpenTelemetry semantic conventions. Use V2 for new deployments. V1 remains only for environments not yet migrated. Deploying the Observer with Helm Install the Observer in the same namespace as your F5Ingress. Get the chart version from your CNFs software package: cd cnfinstall ls -1 tar | grep observer # f5-toda-observer-v4.56.4-0.0.15.tgz Create an observer_values.yaml. At minimum, set the image registry and storage class: image: repository: your-registry.example.com persistence: storageClassName: '' accessMode: ReadWriteOnce size: 3Gi platformType: robin fluentbit_sidecar: image: repository: your-registry.example.com fluentbit: tls: enabled: true fluentd: host: f5-toda-fluentd.cnf-gateway.svc.cluster.local. Install: helm install observer f5-toda-observer-<VERSION>.tgz -f observer_values.yaml Note: The Operator and Receivers share a volume. If they run on the same node, any StorageClass works. If Receivers are distributed across multiple nodes, use a ReadWriteMany-compatible StorageClass, NFS is the standard choice. In my lab I'm installing to a cne-core namespace instead of default namespace. Also, Make sure to update BIG-IP Controller ingress values, as below f5-tmm: ... ... observer: enabled: true image: repository: local.registry.com f5-toda-logging: enabled: true type: stdout fluentd: host: f5-toda-fluentd.cne-core.svc.cluster.local. tmstats: enabled: false Once updated upgrade your helm installation helm upgrade f5ingress f5ingress-v15.82.0-0.2.50.tgz -f deployment/values-ingress-v2.yaml -n cnf-fw-01 Now, you have all the components ready, you can reference the below steps for additional integrations with Grafana and Prometheus. Lab notes In my lab there are some commands I had to run to adjust to the openshift deployment, helm upgrade observer f5-toda-observer-5.22.10-0.2.4.tgz -n cne-core --reuse-values --set persistence.storageClassName=openebs-hostpath oc adm policy add-scc-to-user hostmount-anyuid -z f5-observer -n cne-core oc adm policy add-scc-to-user hostmount-anyuid -z f5-observer-operator -n cne-core oc adm policy add-scc-to-user hostmount-anyuid -z f5-observer-receiver -n cne-core oc secrets link f5-observer <secret> --for=pull -n cne-core oc secrets link f5-observer-operator <secret> --for=pull -n cne-core oc secrets link f5-observer-receiver <secret> --for=pull -n cne-core Wiring Prometheus and Grafana to CNF Metrics The OTEL collector exposes a Prometheus-compatible endpoint on TCP port 9090. It requires mTLS, so valid certificates must be in place before the scrape job succeeds. Step 1 — Create a Prometheus namespace and certificate: kubectl create namespace prometheus kubectl apply -f prom-certs.yaml # cert-manager Certificate manifest Step 2 — Configure Prometheus to scrape OTEL with TLS: serverFiles: prometheus.yml: scrape_configs: - job_name: bnk-otel scheme: https static_configs: - targets: - otel-collector-svc.default.svc.cluster.local:9090 tls_config: cert_file: /etc/prometheus/certs/tls.crt key_file: /etc/prometheus/certs/tls.key ca_file: /etc/prometheus/certs/ca.crt insecure_skip_verify: false server: extraVolumes: - name: prometheus-tls secret: secretName: prometheus-client-secret extraVolumeMounts: - name: prometheus-tls mountPath: /etc/prometheus/certs readOnly: true global: scrape_interval: 10s service: type: NodePort nodePort: 31929 persistentVolume: enabled: false Step 3 — Deploy via Helm: helm install prometheus oci://ghcr.io/prometheus-community/charts/prometheus \ -n prometheus --atomic -f values.yaml //Update otel config map and change line 47 to following debug: verbosity: detailed //Then add following at the end of the configmap exporters: - otlp - deb Step 4 — Verify the scrape target is healthy: curl http://<node-ip>:31929/api/v1/targets | jq Step 5 — List all CNF metrics currently ingested: curl http://<node-ip>:31929/api/v1/label/__name__/values | jq Step 6 — Run a quick query to validate data is flowing: curl "http://<node-ip>:31929/api/v1/query?query=f5_tmm_f5_pool_member_serverside_connections_count_total" | jq For Grafana, add Prometheus as a data source. F5 provides a pre-built Observer dashboard JSON on CloudDocs. The dashboard has three sections: gRPC metrics — Communication performance between Observer containers: call latency and request counts. Go Runtime metrics — Pod resource consumption: goroutine counts, heap memory, object allocation rates. Storage/Aggregation metrics — How the Observer handles dead TMM pod data. When a TMM pod terminates, the Observer runs merge operations to consolidate its metrics. This section shows whether those operations are healthy. Note, you need to update your OTEL definition to include the below //Update otel config map debug: verbosity: detailed //Then add following at the end of the configmap exporters: - otlp - deb //Apply updated OTEL configmap Once done, proceed to rollout the otel deployment oc rollout restart deployment otel-collector -n cnf-fw-01 oc logs otel-collector-6b5c9d5f89-qccqv -f | grep profile_tcp -> table: Str(profile_tcp_stat) -> table: Str(profile_tcp_stat) -> table: Str(profile_tcp_stat) -> table: Str(profile_tcp_stat) -> table: Str(profile_tcp_stat) -> table: Str(profile_tcp_stat) -> table: Str(profile_tcp_stat) -> table: Str(profile_tcp_stat) -> Name: f5.profile_tcp.accepts -> f5.profile_tcp.name: Str(tmstat_tcp) -> f5.profile_tcp.vs_name: Str(qkview_for_tmstatsd) -> observer.job.name: Str(cnf-fw-01/default-scrape-template-66456f74c4/default-job-profile_tcp_stat) -> Name: f5.profile_tcp.accepts -> f5.profile_tcp.name: Str(_mcptcp) -> f5.profile_tcp.vs_name: Str(grpc_mt_10:2) -> observer.job.name: Str(cnf-fw-01/default-scrape-template-66456f74c4/default-job-profile_tcp_stat) -> Name: f5.profile_tcp.accepts -> f5.profile_tcp.name: Str(_mcptcp) -> f5.profile_tcp.vs_name: Str(grpc_mt_4:0) -> observer.job.name: Str(cnf-fw-01/default-scrape-template-66456f74c4/default-job-profile_tcp_stat) -> Name: f5.profile_tcp.accepts -> f5.profile_tcp.name: Str(_mcptcp) -> f5.profile_tcp.vs_name: Str(_grpc_tmm_listener_9) -> observer.job.name: Str(cnf-fw-01/default-scrape-template-66456f74c4/default-job-profile_tcp_stat) -> Name: f5.profile_tcp.accepts -> f5.profile_tcp.name: Str(_cgctcp_in) Troubleshooting via Metrics V2 Now, we have better capabilities of actually monitoring traffic across multiple pods and TMMs from single location, [cloud-user@ocp-provisioner f5-cne-2.2.0]$ oc exec sts/f5-observer-receiver -n cne-core -- mdb --list | grep "/cnf-fw-01/" Defaulted container "f5-observer-receiver" out of: f5-observer-receiver, fluentbit 2026/07/15 18:12:09 INFO dialing to observer addr=0.0.0.0:8088 f5-log-ID=0612007a cnf-fw-01/tmm/f5-tmm-fcc888779-w98zh:f5-tmm:ae28ae8bf4ecb2de9f9a1d0674fb47f8acb2eab1bb46727e285e2cbcae87266b/cnf-fw-01/fw_context_stat 2026-07-15 18:11:22 763 cnf-fw-01/tmm/f5-tmm-fcc888779-w98zh:f5-tmm:ae28ae8bf4ecb2de9f9a1d0674fb47f8acb2eab1bb46727e285e2cbcae87266b/cnf-fw-01/virtual_server_stat 2026-07-15 18:11:22 3101 cnf-fw-01/tmm/f5-tmm-fcc888779-w98zh:f5-tmm:ae28ae8bf4ecb2de9f9a1d0674fb47f8acb2eab1bb46727e285e2cbcae87266b/cnf-fw-01/dns_cache_resolver_stat 2026-07-15 18:11:22 5162 cnf-fw-01/tmm/f5-tmm-fcc888779-w98zh:f5-tmm:ae28ae8bf4ecb2de9f9a1d0674fb47f8acb2eab1bb46727e285e2cbcae87266b/cnf-fw-01/profile_dns_stat 2026-07-15 18:11:22 7500 cnf-fw-01/tmm/f5-tmm-fcc888779-w98zh:f5-tmm:ae28ae8bf4ecb2de9f9a1d0674fb47f8acb2eab1bb46727e285e2cbcae87266b/cnf-fw-01/profile_tcp_stat 2026-07-15 18:11:22 972 cnf-fw-01/tmm/f5-tmm-fcc888779-w98zh:f5-tmm:ae28ae8bf4ecb2de9f9a1d0674fb47f8acb2eab1bb46727e285e2cbcae87266b/cnf-fw-01/pool_member_stat 2026-07-15 18:11:22 2156 cnf-fw-01/tmm/f5-tmm-fcc888779-w98zh:f5-tmm:ae28ae8bf4ecb2de9f9a1d0674fb47f8acb2eab1bb46727e285e2cbcae87266b/cnf-fw-01/fw_rule_stat 2026-07-15 18:11:22 1588 cnf-fw-01/tmm/f5-tmm-fcc888779-w98zh:f5-tmm:ae28ae8bf4ecb2de9f9a1d0674fb47f8acb2eab1bb46727e285e2cbcae87266b/cnf-fw-01/dos_stat 2026-07-15 18:11:22 3828 cnf-fw-01/tmm/f5-tmm-fcc888779-w98zh:f5-tmm:ae28ae8bf4ecb2de9f9a1d0674fb47f8acb2eab1bb46727e285e2cbcae87266b/cnf-fw-01/fw_container_stat 2026-07-15 18:11:22 1213 Now, let's have a closer look at one of the segments, below is the FW context [cloud-user@ocp-provisioner f5-cne-2.2.0]$ oc exec sts/f5-observer-receiver -n cne-core -- mdb --segment cnf-fw-01/tmm/f5-tmm-fcc888779-w98zh:f5-tmm:ae28ae8bf4ecb2de9f9a1d0674fb47f8acb2eab1bb46727e285e2cbcae87266b/cnf-fw-01/fw_context_stat Defaulted container "f5-observer-receiver" out of: f5-observer-receiver, fluentbit 2026/07/15 18:12:49 INFO dialing to observer addr=0.0.0.0:8088 f5-log-ID=0612007a -----BEGIN RESOURCE----- Meta: Name: fw_context_stat Unit: Annotations: k8s.namespace.name: cnf-fw-01 Labels: f5.firewall.context.context_name: cnf-fw-01-forwarding-any-virtual-server-SecureContext_vs f5.firewall.context.context_type: virtual f5.firewall.context.policy_type: 1 TTL: 0s Value: [2428 0 0 0] -----END RESOURCE----- Now, let's have a look at the virtual servers stats [cloud-user@ocp-provisioner f5-cne-2.2.0]$ oc exec sts/f5-observer-receiver -n cne-core -- mdb --segment cnf-fw-01/tmm/f5-tmm-fcc888779-w98zh:f5-tmm:ae28ae8bf4ecb2de9f9a1d0674fb47f8acb2eab1bb46727e285e2cbcae87266b/cnf-fw-01/virtual_server_stat Defaulted container "f5-observer-receiver" out of: f5-observer-receiver, fluentbit 2026/07/15 18:14:24 INFO dialing to observer addr=0.0.0.0:8088 f5-log-ID=0612007a -----BEGIN RESOURCE----- Meta: Name: virtual_server_stat Unit: Annotations: k8s.namespace.name: cnf-fw-01 Labels: f5.virtual_server.destination: 0.0.0.0 f5.virtual_server.name: cnf-fw-01-forwarding-any-virtual-server-SecureContext_vs f5.virtual_server.source: 0.0.0.0 TTL: 0s Value: [1844667 108023672 0 4 28282 69732 2542 0 0 0 0 108023672 1844587 0 4 69732 28280 2542] -----END RESOURCE----- -----BEGIN RESOURCE----- Meta: Name: virtual_server_stat Unit: Annotations: k8s.namespace.name: cnf-fw-01 Labels: f5.virtual_server.destination: 10.1.20.100 f5.virtual_server.name: cnf-fw-01-cnf-dohapp-virtual_server f5.virtual_server.source: 0.0.0.0 TTL: 0s Value: [0 0 0 0 0 0 0 0 0 0 0 0 0 0 0 0 0 0] -----END RESOURCE----- -----BEGIN RESOURCE----- Meta: Name: virtual_server_stat Unit: Annotations: k8s.namespace.name: cnf-fw-01 Labels: f5.virtual_server.destination: 10.1.30.100 f5.virtual_server.name: cnf-fw-01-dnsx-app-listener-virtual_server f5.virtual_server.source: 0.0.0.0 TTL: 0s Value: [0 0 0 0 0 0 0 0 0 0 0 0 0 0 0 0 0 0] -----END RESOURCE----- With Observer you have aggregated observer receiver to monitor and observe your CNF deployment. Conclusion As a conclusion, why would you go to V2 metrics vs V1, there are four pain points with V1 in distributed environments: Stream count; One virtual server across six TMM pods gives you six independent metric series in Prometheus, same stat, six rows, differentiated only by tmmID. That's not an observability system. That's a spreadsheet you have to reassemble manually every time you open Grafana. Data loss; A pod gets evicted mid-scrape and its cumulative counters are gone. The Receiver in the TODA pipeline holds that data in a local volume and merges it before export. Your charts stay clean. PromQL tax; In V1, every panel needs a sum() by (virtual_server) wrapper or the numbers are wrong. Not approximately wrong, it's wrong by a factor of N. V2 aggregates inside the pipeline, at the Observer, before the metric ever reaches Prometheus. One series. Use it directly. The naming; V1 embeds the VS name in the metric path. That's not how Prometheus is supposed to work, and everything downstream, like alerting rules, federation, label matchers fight it. V2 puts the VS identity where it belongs: as an attribute, f5.virtual_server.name. Short metric name, proper labels, and PromQL that actually reads like PromQL. The TODA pipeline ( TMM Scraper, Receiver, Observer ) exists specifically to close the visibility gap. The Receiver is the persistence layer. The Observer is the aggregation engine. Together they turn N pod streams into one coherent signal. If you take one thing from this: aggregation has to happen somewhere. In V1, it happens in your head, on every dashboard panel, every time. In V2, it happens in the pipeline, once, before the data leaves the cluster. That's the whole difference. Related Resources Distributed TODA for Stats Aggregation CNFs Event Logs Performance Visualization (Prometheus + Grafana) OTEL Statistics Reference CNF Log Formats Reference Debug Sidecar Overview Troubleshooting Common Errors 102Views3likes0Comments
F5 Migration between DCs
I have couple of F5's in a data center and want to migrate to single F5 in different DC. All the F5 configurations including the VIP's, Profile, certificate needs to be consolidated into single F5. What approach need to be taken to migrate the config's. Would GUI or CLI migration approach or advise the best way forward. Any help Appreciated.236Views0likes7CommentsF5 Distributed Cloud – Unit and Integration tests with Terraform
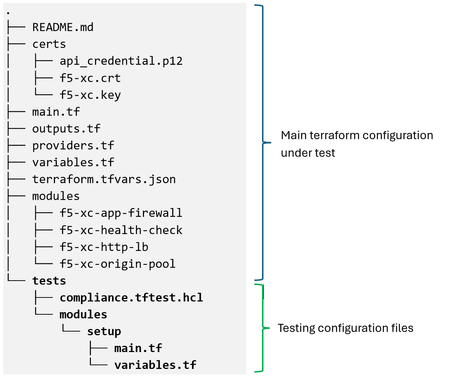
Introduction The Terraform test framework provides module authors with an integrated way to run unit and integration tests. It verifies that code changes do not introduce breaking behavior before production rollout. Terraform test prevents any risk on the existing state or infrastructure by keeping the state file in memory as an ephemeral entity. It never writes to a terraform state file, ensuring tests run completely separate from regular plan or apply workflows. The framework supports two testing models: Unit Testing: Runs a terraform plan to validate custom logic, calculations, and input conditions without provisioning real resources. This mode is fast, free, and runs entirely in memory. Integration Testing: Runs terraform apply to create temporary infrastructure, perform assertions against live resources, and automatically destroy those resources when the test completes. By default, test runs use command = apply, so integration testing creates real infrastructure and validates behavior against those deployed resources. To perform unit testing without creating infrastructure, you can override this behavior by setting the command attribute in a run block to plan. Configuration The following example shows a directory structure for terraform native tests: The main terraform configuration is based on the WAAP protected HTTP applications example: https://github.com/f5devcentral/f5-professional-services/tree/main/examples/f5-distributed-cloud/terraform/f5-xc-terraform-test. The compliance.tftest.hcl includes the logic to validate the following test cases: Check Compliance Run block Validate that a required Service Policy is inherited from the namespace if the Load Balancer is advertised on the public network and the origin server is behind a Customer Edge (CE) Security service_policy Validate that a required Service Policy is applied directly to the Load Balancer if it is advertised on the public network and the origin server is behind a CE Security service_policy Check that an App Firewall policy is applied to the HTTP Load Balancer if it is advertised on the public network Security app_firewall Verify that the Load Balancer name complies with the RFC 1035 Domain Names. Naming Governance http_load_balancer_name Verify that the HTTP Load Balancer quota is not exceeded. Resource governance quota_usage A helper module is included for managing test-specific resources such as data sources. It uses F5 Distributed Cloud Services API to get current quota usage for HTTP Load Balancers and the active namespace Service Policies: # setup module # Fetch data from a REST API data "http" "xc_quota_usage" { url = "${var.api_url}/web/namespaces/system/quota/usage" request_headers = { Accept = "application/json" } client_cert_pem = file(var.f5-xc_cert) client_key_pem = file(var.f5-xc_key) } data "http" "xc_active_sp" { url = "${var.api_url}/config/namespaces/${var.namespace}/active_service_policies" request_headers = { Accept = "application/json" } client_cert_pem = file(var.f5-xc_cert) client_key_pem = file(var.f5-xc_key) } # Use the response locals { xc_quota_usage = jsondecode(data.http.xc_quota_usage.response_body) xc_active_sp = jsondecode(data.http.xc_active_sp.response_body) } Below is the outputs.tf file for the module: output "xc_quota_usage" { value = { "HTTP" = local.xc_quota_usage.objects.http_loadbalancer.usage.current } } output "xc_active_sp" { value = local.xc_active_sp.service_policies[*].name } The variables.tf file used by the module is shown below: # setup module variables variable "tenant" { default = "<tenant_id>" } variable "api_url" { default = "https:// <tenant_name>.console.ves.volterra.io/api" } variable "f5-xc_cert" { default = "./certs/xc.crt" } variable "f5-xc_key" { default = "./certs/xc.key" } variable "namespace" { default = "default" } The main test file included in the test directory, compliance.tftest.hcl, contains the test logic within run blocks that applies a terraform “plan” or “apply” command to perform assertions on the resulting state: # compliance.tftest.hcl run "global_setup" { # This block initializes a module to fetch information required # for testing. module { source = "./tests/modules/setup" } } run "service_policy" { command = plan variables { required_service_policies = "allow-vpn-ip-demo-sp" } # Check that a required Service Policy is inherited from the # namespace if the Load Balancer is advertised on the public # network and the origin server is behind a CE assert { condition = ( module.http-lb.app_lb_default_vip == false ? true : module.origin.private_origin == false ? true : (module.http-lb.app_lb_ns_service_policies == false ? true : contains(flatten(run.global_setup.xc_active_sp), var.required_service_policies)) ) error_message = "Service Policy \"${var.required_service_policies}\" must be associated with Load Balancer ${module.http-lb.app_lb_name} or inherited from the namespace." } # Check that a required Service Policy is applied directly to the # Load Balancer if it is advertised on the public network and the # origin server is behind a CE assert { condition = ( module.http-lb.app_lb_default_vip == false ? true : module.origin.private_origin == false ? true : (module.http-lb.app_lb_ns_service_policies == true ? true : contains(flatten(module.http-lb.app_lb_active_service_policies), var.required_service_policies)) ) error_message = "Service Policy \"${var.required_service_policies}\" must be explicitly associated with Load Balancer ${module.http-lb.app_lb_name} or inherited from the namespace." } } run "app_firewall" { command = plan # Check that an App Firewall policy is applied to the HTTP Load # Balancer if it is advertised on the public network assert { condition = module.http-lb.app_lb_default_vip == false ? true : length(module.http-lb.app_lb_app_firewall) > 0 error_message = "An App Firewall must be associated with Load Balancer ${module.http-lb.app_lb_name} if advertised on Internet " } } run "http_load_balancer_name" { command = plan # Check that the Load Balancer name is correct assert { condition = can(regex("^[a-z]([-a-z0-9]*[a-z0-9])?$", local.http-lb-name)) && length(local.http-lb-name) <= 63 error_message = "The resource name must be a valid DNS-1035 label: 1-63 lower-case alphanumeric characters or '-', starting with a letter and ending with an alphanumeric character." } } run "quota_usage" { command = plan # Check that the HTTP Load Balancer quota is not exceeded assert { condition = run.global_setup.xc_quota_usage["HTTP"] <= 200 error_message = "HTTP Load Balancer quota exceeded" } } The assert blocks within each run block define conditions that must evaluate to true for the test to pass. Running the tests 1. Initialize Terraform configuration. To run the tests, the Terraform workspace needs to be initialized to configure the backend and install all providers and modules referred to in the configuration (main and test): 2. Running the initial test When the terraform test command is executed, it scans the current root directory ./ and the subdirectory ./tests/ for files with .tftest.hcl or tftest.json extensions. To overwrite the default discovery behavior, the following command line flags can be used: Behavior Flag Example Change the testing directory test -test-directory terraform test -test-directory=integration-tests Run a specific test file filter terraform test -filter=tests/validation.tftest.hcl This is the main tfvars file, used to validate the run blocks { "tenant": "<tenant_id>", "api_url": "https://<tenant_name>.console.ves.volterra.io/api", "api_p12_file": "./certs/api_credential.p12", "f5-xc_cert": "./certs/xc.crt", "f5-xc_key": "./certs/xc.key", "base": "demo-app", "namespace": "demo", "domains": ["demo-app.demo.net"], "origin_servers": [ { "origin": "1.2.3.4", "site": "", "virtual_site": "onprem-demo-vs", "network": "inside" }, { "origin": "5.6.7.8", "site": "", "virtual_site": "onprem-demo-vs", "network": "outside" } ], "environment": "prod", "waf_policy": true, "service_policy": [ { "name": "allow-vpn-ip-demo-sp", "namespace": "shared" }, { "name": "allowed-sources-demo-sp", "namespace": "demo" } ], "origin_pool_port": 80, "use_tls": false } When all the assertions in the execution block pass, the test is considered successful 3. Validation of assertions 3.1. Unit testing To perform unit testing, the tests can be executed using the command = plan attribute. Setting the command to plan forces Terraform to only generate an execution plan and validate your configuration logic without creating real cloud resources, making the process fast and safe. Example 1: The required Service Policy is not active in the namespace, the Load Balancer is configured with the default setting to apply namespace policies, it is advertised on the public network, and the origin server is behind a CE. Service Policy "allow-vpn-ip-demo-sp" service policy is not in the namespace Active Service Policies: Example 2: The required Service Policy is not associated with the Load Balancer when a specific list of Service Policies is applied, it is advertised on the public network, and the origin server is behind a CE. Service Policy "allow-vpn-ip-demo-sp" service policy is removed from the tfvars file: Example 3: Verify that an App Firewall policy is applied to the HTTP Load Balancer if it is advertised on the public network. To force this test to fail, the waf_policy variable is set to false in the tfvars file: Example 4: Verify that the HTTP load balancer name conforms with the core RFC DNS 1035 rules. To force this test to fail, a period is added to the base variables in terraform.tfvars.json: Example 5: Verify that the HTTP load balancer quota has not been exceeded. To force this test to fail, a value lower than the current quota is added to the condition: 3.2. Integration testing To perform integration tests, we can run them using the command = apply attribute. By setting the command as apply, Terraform provisions real infrastructure, runs the assertions against the live resources and then automatically destroys them. Example: The required Service Policy is not active in the namespace, the Load Balancer is configured with the default setting to apply namespace policies, it is advertised on the public network, and the origin server is behind a CE. Service Policy "allow-vpn-ip-demo-sp" service policy is not in the namespace Active Service Policies: The ephemeral resources are created: The audit log entries record the creation and deletion of resources: Conclusion The native terraform test framework offers a secure and unified way to validate F5 Distributed Cloud Services Infrastructure by operating against test-specific, short-lived resources. This lets you detect breaking changes early and use the assertions as built-in guardrails, ensuring infrastructure code quality without complex external dependencies.196Views0likes0Comments
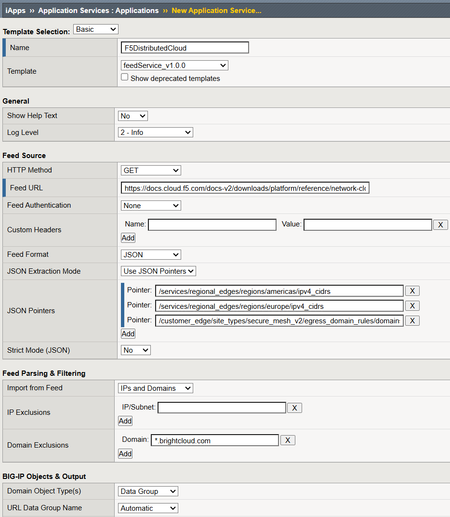
feedService: Automate Threat Feed and Blocklist Ingestion on BIG-IP (iApp + Python)
feedService is an iApp- and Python-based automation solution for F5 BIG-IP that automatically downloads, validates, normalizes, and imports feed data into native BIG-IP constructs — with intelligent data classification, change detection, and scheduled updates via iCall.114Views3likes0CommentsOracle WebLogic Server
F5 and Oracle have long collaborated on delivering market-leading application delivery solutions for WebLogic Server. F5 has designed an integrated, agile, and adaptable network platform for delivering WebLogic applications across the LAN and WAN, and packaged this information in our deployment guides and iApp templates. The result is an intelligent and powerful solution that secures and speeds your WebLogic deployment today, while providing an optimized architecture for the future. The following simple, logical configuration example shows one of the ways you can configure the BIG-IP system for Oracle WebLogic Servers using BIG-IP AAM technology to speed traffic across the WAN. See https://f5.com/solutions/deployment-guides to find the appropriate deployment guide for quickly and accurately configuring the BIG-IP system for Oracle WebLogic Server. If you have any feedback on these or other F5 guides or iApp templates, leave it in the comment section below or email us at [email protected]. We use your feedback to help shape our new iApps and deployment guides.620Views0likes2Comments
Multiple two-way SSL client Profiles - possible?
Hello To simply describe my situation: multiple end-users with client SSL certs generated by different CAs (down to rootCAs, which are different) one VIP to server them all and perform two-way SSL with "peer-cert-mode required" in the client-ssl profile. the FQDN for the VIP is the same for all end-users, so the server-side certificate is the same for all of them platform used: redundant BigIP LTM i4800 running v17 My initial reaction was to "bundle" all the different CAs into one file and use it as such under the client-ssl profile (it works) But... I was thinking if I could create and attach to the VIP multiple client-ssl profiles for each of the CAs (each with its own defined ca-file), using the same server-side certificate (with at least one of these profiles to have the sni-default set to true), and also keeping the "peer-cert mode required" for each of these distinct client-ssl profiles. Would this even be possible, what would this break or what gotchas I should be aware of,? ltm profile client-ssl mTLS-profile1 { ca-file firstCA.crt cert serverSide.crt chain serverSide-chain.crt key serverSide.key peer-cert-mode require retain-certificate false sni-default true } ltm profile client-ssl mTLS-profile2 { ca-file secondCA.crt cert serverSide.crt chain serverSide-chain.crt key serverSide.key peer-cert-mode require retain-certificate false sni-default false } ltm profile client-ssl mTLS-profile3 { ca-file thirdCA.crt cert serverSide.crt chain serverSide-chain.crt key serverSide.key peer-cert-mode require retain-certificate false sni-default false } ltm virtual server-fqdn-vip { ... profiles { mTLS-profile1 { context clientside } mTLS-profile2 { context clientside } mTLS-profile3 { context clientside } } ... } Thank you in advance Adrian181Views0likes2CommentsRegional Edge SaaS Application Deployment Recommended Practices
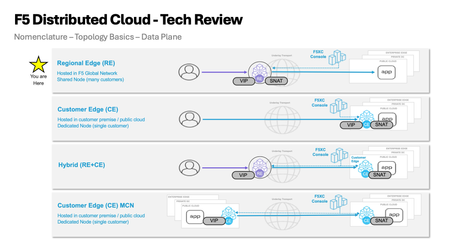
The guidelines presented in this walkthrough are informed by extensive field experience, incorporating insights from customers, F5 Solutions Engineers, Architects, and Professional Services teams. Having supported numerous deployments across diverse environments, this cumulative knowledge provides a practical and reliable starting point for publishing applications. This guide aims to help navigate the Distributed Cloud platform, offering a balanced approach to application delivery and security. The below figure represents the HTTP-LB configuration options alongside the typical flow of traffic from downstream client to upstream origin or application endpoint. Prerequisites: Article on how Distributed Cloud advertises and picks up traffic (Listener Logic) can be found here: F5 Distributed Cloud - Listener Logic Domains and Certificates: This is where you define what the load balancer listens on and how it presents itself to clients. For an initial deployment with a publicly accessible application, the following settings cover most use cases. We recommend a single HTTP-LB per application for visibility, telemetry, day 2 operations, and blast radius. Any more consolidation may cause friction going forward. Recommended Settings: Domain Name:Your application FQDN (e.g., app.example.com) Load Balancer Type: Certificate: Use F5 XC Auto-Cert when possible. If your domain is delegated to XC DNS, certificate management is fully automated. For non-delegated domains, F5 XC provides a cname challenge record value that you can add to your DNS provider to satisfy the Lets Encrypt ACME challenge, then add the provided Host Name.ves.io CNAME record pointing to XC to complete the certificate setup HTTP to HTTPS Redirect:Enable HSTS Header:Enable Listener Port: 443 Client-Side TLS: High security profile Protocol: HTTP/1.1 and HTTP/2 Origins and Health Checking: Origin Pools: A note on structure and origin access: Use Routes (covered in the next section) as the primary mechanism for attaching Origin Pools to your HTTP LB. The default Origin Pool field on the HTTP LB itself is best reserved as a potential fallback option depending on origin and route design (Engage your F5 SE if you need to discuss further). This approach gives you path-aware routing controls and per-route retry and timeout tuning. Also at the origin premise you should limit access to F5 Distributed Cloud RE’s only. You have a few options to achieve this. Limit via a security group or IP Access List to RE IP ranges, mTLS, insert a response header from the HTTP-LB that the origin server is expecting, or a combination of the 3. Recommended Settings for Publicly Available Endpoints: Origin Server Type: Public IP-based. Provide the IPv4 address directly. Where possible, target origins by IP with Host Header. If using public DNS-based origin endpoint targeting, be aware that XC does not honor standard DNS TTL and overrides the value! Origin Server Port: 443 Connection Pool Reuse: Enable Health Check Port: Endpoint port (same as origin port unless otherwise directed) Load Balancing Algorithm: Load Balancer Override (Load Balancer algorithm set at HTTP-LB) Endpoint Selection: Local Endpoints Preferred (Distributed Cloud Construct to leverage local endpoints over remote endpoints goal is to Egress the same RE as Ingress) TLS to Origin: Enable TLS SNI: Host Header TLS Security Level: High Origin Server Verification: Use Default Root CA Certificate mTLS: Disable unless required Other Origin Pool Options: Exception Handling: Setup for specific application/origin server requirements (configurable options available for application specific error-handling requirements) Origin Server Subsets: Disable unless you have a specific canary or subset routing requirement HTTP Protocol Configuration: Automatic (adjust to a specific version if your origin requires it) Proxy Protocol: Disable LB Source IP Persistence: Disable Health Checks: The default health check thresholds are tuned conservatively. In practice, this means a failed origin stays in rotation longer than it should, and a recovered origin comes back into rotation slowly. Adjust the thresholds to react more aggressively to recovery while still being tolerant of transient failures. Recommended Health Check Settings: Setting Recommended Value Default Why Healthy Threshold 1 3 Bring a recovered endpoint back into rotation after a single successful check Unhealthy Threshold 3 1 Require 3 consecutive failures before removing an endpoint — avoids flapping on transient issues Interval 15 seconds 15 seconds No change needed Jitter Percent 30% 30% Stagger health check timing across endpoints (30% of 15s = up to 4.5s offset) Key insight for jitter setting: When you have multiple endpoints in a pool, health checks without jitter all fire at the same instant that can create amongst other issues a temporary artificial network congestion or failure at endpoints. The 30% jitter setting randomizes the start time of each health check within a window (default: 15s interval with a 30% jitter, so checks are offset by up to 4.5 seconds). Leave this at the default unless you have a specific reason to change it. Advanced health check options: Host Header: Set to the value your application expects (do not leave blank if your origin validates the Host header) Path: Set a meaningful health endpoint like /healthz a common convention, but use whatever your application exposes Expected Status Codes: 200, 3xx Request/Response Header Manipulation: Add or remove headers as required by your application Expected http response: Validate the Raw Bytes expected in the Response of HTTP Health Check Origin Pool Display in UI: Routes: Routes are where your HTTP LB gains precision. Rather than sending all traffic to a single origin pool, Routes let you make forwarding decisions based on path, method, headers, and query parameters. They also expose per-route controls for timeouts, retries, header manipulation, and security policy controls that are not available at the origin pool level. Recommended Route Configuration: Route Type: Simple Route HTTP Method: Any Path Match: Prefix (use Regex or Exact match when you need more specificity) / Headers: Add header match conditions only if required Port Match: Adjust only if needed Origin targeting: Origin Pools:Add the Origin Pool(s) you configured in the previous section Host Rewrite Method: Automatic Host Rewrite (or set a specific value if your origin requires a fixed Host header) Query Parameters: Retain (Remove and Replace are available options) Route Activation: Enabled (Disable option) Advanced route options: Load Balancing Control: Use LB Hash Policy Priority: Default Origin Server Subsets: Leave unset unless subset routing is required Request/Response Manipulation: Header add/remove, cookie add/remove, set-cookie add/remove -configure as needed for your application Security (per-route overrides): WAF:Inherit from HTTP LB (recommended) or specify a different policy per route WAF Exclusion:Inherit from HTTP LB or specify an Exclusion Policy — see the note in the Gotchas section below on inline exclusions CORS and CSRF:Configure as needed Protocol Upgrades: SPDY:Disable (enable only if required) WebSockets:Disable (enable only if your application requires WebSocket support) Retry Policy: Key insight “retry values”: The retry settings below are tuned for typical HTTPS application traffic. The per-retry timeout of 1000ms prevents a slow origin from consuming the full route timeout on every attempt, and the retry interval backoff (25ms initial, 2500ms max) avoids hammering a struggling origin. Validate these values with load testing before going live. Custom Retry Policy Settings: Retry Conditions: 500 Gateway-error Connect-failure Refused-stream Reset Retriable-4xx Number of Retries: 3 Per-Retry Timeout: 1000ms Retry Interval: 25ms Max Retry Interval: 2500ms Miscellaneous Route Options: Route Timeout: 30000ms (30 seconds) Route-Specific Buffering: Common Mirroring: Disable Cluster Retract: Disable (validate with testing before enabling) Security Settings: Security configuration in F5 XC is layered. The settings below represent a solid baseline for an initial deployment. Individual applications will likely require tuning — use this as a starting point, not a final state. Web Application Firewall: The recommended starting posture is blocking mode with High and Medium attack signatures active. This catches the most common attack patterns while keeping false positive rates manageable. Do not start in detection-only mode and leave it there — establish a review cycle and move to blocking on a defined schedule. WAF: Enable Enforcement Mode: “Monitor” then after review migrate to “Blocking” Security Policy:Custom Attack Signatures: Default signature set High, Medium, and Low severity Automatic Attack Signature Tuning:Disable Automatic Signature Staging:Enable (7days) Threat Campaigns:Enable Violations:Default Signature-Based Bot Detection:Default Enhance with AI: Enable Mitigate High and Medium (have a review cadence) WAF Exclusion: Use a dedicated WAF Exclusion Policy object — do not use inline exclusions (see Gotchas below) Additional WAF-adjacent features — configure as needed for your application: Data Guard CSRF Protection GraphQL Inspection Cookie Protection API Protection: Enable as needed. If your application exposes a defined API surface, uploading an OpenAPI spec and enabling API Discovery is a worthwhile early step. Malware Protection: Disable DoS Settings: Mitigation Action: Block RPS Threshold: Typically based on Capacity of origin application endpoints Client-Side Challenge: Enabled if web based application Custom Service Policy for DoS: Apply a specific geo location and IPI during DDoS DDoS Mitigation Rules: Default Slow DDoS: Default Service Policies: Service Policies match on a set of criteria and apply an action. They operate at the connection level and complement WAF, which operates at the request content level. Service Policies: Apply Specified Service Policies (list any access restriction policies you need) IP Reputation: select the reputation categories appropriate for your threat model Threat Mesh: Disable User Identifier Policy: Create a policy using Client IP and TLS Fingerprint based on JA4 as identifiers (other identifier types are available) Malicious User Detection: Enable Malicious User Mitigation: Enable, Default settings Rate Limiting: Configure as needed based on expected traffic profile Trusted Client Rules: Configure as needed Client Blocking Rules: Configure as needed CORS Policy: Configure as needed Other Settings: VIP Advertisement: This is what makes the HTTP LB publicly reachable through the F5 Regional Edge network. If you change this to a Custom setting, validate your advertisement policy carefully as a misconfiguration here means no traffic reaches your LB. Advertise Internet Load Balancing Algorithm: Choose based on your application's session and traffic characteristics. Round Robin is the default and works for most stateless applications. If you have session affinity requirements, evaluate the hash-based options. Trusted Client IP: Disable unless you have a specific use case that requires preserving the original client IP through a proxy chain upstream of XC. Location Header: Enable “Add XC RE Ingress Location” to include the Regional Edge location in response headers. This is useful for troubleshooting and for understanding which RE node handled a request. Header and Cookie Options: Configure request/response header additions, removals, and cookie manipulation as required by your application. Error Response: Configure custom error response pages as needed. The default F5 error pages are functional but not branded. Most production deployments will want custom responses for 4xx and 5xx errors. Buffer Policy: Default: No buffering (requests are streamed to the origin) Max Buffer Size: 10,485,760 bytes (10MB) – if the request body exceeds this, XC returns HTTP 413 (Payload Too Large) Timeout behavior: If the full request body is not received before the timeout, XC returns HTTP 408 (Request Timeout) When to enable: Enable buffering if your origin cannot handle streaming request bodies, or if you are using WAF inspection on large POST requests Compression: Algorithm: GZIP only (not configurable) Compression Level: 5 (not configurable) Behavior: XC compresses responses dispatched from the upstream origin when the client signals support via “Accept-Encoding” Enable if your origins do not already compress responses and your client traffic includes browser-based users Idle Timeout: Default: Client Side - 30 seconds Behavior: A stream with no activity (upstream or downstream) for this duration is terminated with HTTP 504 Increase for applications with long-running server-sent events, streaming responses, or slow upload scenarios Common Gotchas: These are the issues that come up repeatedly in initial deployments. Check these before you go live. Using DNS-based origin targeting instead of IP + Host Header: By default Distributed Cloud rewrites the host header so validate and set appropriately. DNS-based origin targeting works but introduces a dependency on DNS TTL behavior that XC does override in non-standard ways. During a failover event, you may experience stale resolution longer than you expect. Use IP-based origin with Host Header wherever possible for predictable behavior. Not Configuring a Health Check at all or Leaving health check thresholds at defaults: By default, a health check is not added to an origin pool. Also, the default Healthy Threshold of 3 means a recovered origin must pass 3 consecutive checks before re-entering rotation. If your check interval is 15 seconds, that is 45 seconds of unnecessary exclusion for an endpoint that came back healthy. Set Healthy Threshold to 1. The default Unhealthy Threshold of 1 is the opposite problem a single failed check removes the endpoint. Set Unhealthy Threshold to 3 to tolerate transient blips. Attaching Origin Pools directly to the HTTP LB instead of utilizing Routes: The default Origin Pool field on the HTTP LB is a catch-all fallback. If you attach your primary origin there and do not configure Routes, you lose access to per-route retry policies, timeouts, header manipulation, and security overrides. Build your routing structure with explicit Routes from the start. Starting in WAF Monitor mode and never switching to blocking: Monitoring mode is a valid tuning step, but it is easy to leave it there indefinitely. Set a review date when you configure monitor mode. Establish your false positive baseline and move to blocking on a defined timeline. Not setting a Host Header on the health check: Leaving the Idle Timeout at 30 seconds for streaming applications: The 30-second idle timeout will terminate long-lived connections, WebSocket connections, server-sent event streams, slow uploads without warning. If your application uses any of these patterns, increase the Idle Timeout before testing.110Views1like0Comments