Forum Discussion
 Cirrus
BigIP F5 LTM fails during Load testing
My Set up has a BIGIP single CPU hosted on AWS.This sits in front of a node API i use for load testing.
Now when i send a 1K_1krpm request..i.e., 5000 requests in 5 mins to my node api via the BIG IP LTM it goesthrough without any errors.
But the moment i start sending requests to my node api atthge rate of 1K_10krpm ie., 10000 requests/min for 5 mins i start getting errors in Jmeter and it seems the big IP F5 LTM is blocking requests.
Please note my request size is less than 64KB and so this issue isnt affecting me.Any setting that i should edit to allow me to make 10000req/min or 60000/min?
21 Replies
Hi sand86ch,
Can you tell us the type of errors jmeter is reporting? During TCP connects, SSL handshakes, HTTP related timeouts, TCP reset after sending HTTP requests, bad HTTP responses?
Do you have the feeling to hit a certain hard limits, or is the error rate progressive?
How many TCP session do you use for the Test? What is your RTT between Client and F5. HTTP/2 or HTTP/1.1 tests?You may explain your VS setup slightly to allow us to understand where bottlenecks could be happen? Using SNAT / SNAT Pools, using SSL-Offload, OneConnect?
Do you see any abnormal logs in LTM? Things which only appear when load gets too high?
Could you please reset your VS, HTTP profile and Pool statistics and share the results after a test is done?Lets see if we could push you in the right direction to figure out your bottleneck...
Cheers, Kai
 sand87ch
Please find my answers below along with relevant screenshots.I hope my answers are satisfactory.
Can you tell us the type of errors jmeter is reporting? During TCP connects, SSL handshakes, HTTP related timeouts, TCP reset after sending HTTP requests, bad HTTP responses?
Ans. Dont see any error as such in jmeter.log.
Do you have the feeling to hit a certain hard limits, or is the error rate progressive?
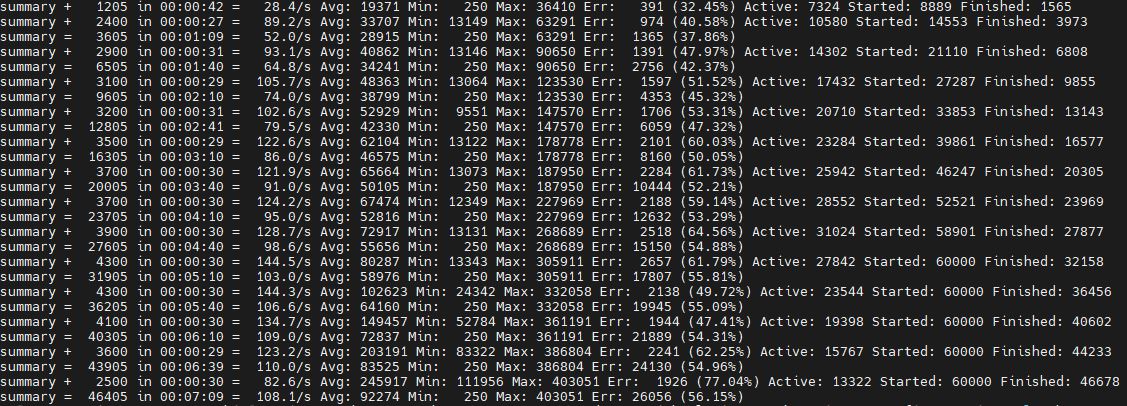
Ans.I feel the error is due to certain limits because the way i test is like the no of threads will be equal to the total number of requests that must be sent in 5 mins.eg. if its 10000/min then 50000 threads.I am able to say so because when i was sendind 1000req/min i.e., 5000/min i saw no errors.Please find the attachment for this.The error rate is progressive.
How many TCP session do you use for the Test? What is your RTT between Client and F5. HTTP/2 or HTTP/1.1 tests?
Ans .I dont know how to find out the number of tcp sessions while running the Jmeter test.The round trip time for a single postman call to my node(node js application) ranges between 2.32 to 2.50 secs.
You may explain your VS setup slightly to allow us to understand where bottlenecks could be happen? Using SNAT / SNAT Pools, using SSL-Offload, OneConnect?
Ans.Since this is a trial license and we are running on one CPU i havent configured SNAT / SNAT Pools, using SSL-Offload, OneConnect .My BIG IP LTM is hosted on an AWS ec2-instance which points to a pool consisting of the node(ec2-instance) having a node js application that is used for load testing.The requests made to this server has les size.This app responds with a response size as preferred.We control this via a parameter in our curl/postman call.
Could you please reset your VS, HTTP profile and Pool statistics and share the results after a test is done?
Ans.Reset Pool statistics,couldnt find how to reset VS and HTTP Profile and hence updated VS.
> Ans. Dont see any error as such in jmeter.log.
Log information are indeed not that helpful to figure out the cause of the err 😞
> Ans.I feel the error is due to certain limits because the way i test is like the no of threads will be equal to the total number of requests that must be sent in 5 mins.eg. if its 10000/min then 50000 threads.I am able to say so because when i was sendind 1000req/min i.e., 5000/min i saw no errors.Please find the attachment for this.The error rate is progressive.
I assume a single thread opens a single TCP connection from your client to the F5 and just sends a single request to the F5. The F5 will then open for each client side TCP connection a unique server side TCP connection. Unless you exceed 64k concurrent connections (limitation if not using SNAT pools) you should not hit a well known hard limit. Seems to be a pure load specific issue then...
> Ans .I dont know how to find out the number of tcp sessions while running the Jmeter test.The round trip time for a single postman call to my node(node js application) ranges between 2.32 to 2.50 secs.
See answer above. If using a single TCP connection for each request the response time should not matter.
Ans.Since this is a trial license and we are running on one CPU i havent configured SNAT / SNAT Pools, using SSL-Offload, OneConnect .My BIG IP LTM is hosted on an AWS ec2-instance which points to a pool consisting of the node(ec2-instance) having a node js application that is used for load testing.The requests made to this server has les size.This app responds with a response size as preferred.We control this via a parameter in our curl/postman call.
Can you please provide screenshoot of the VS configuration? Gray out sensible information as needed.
Did you checked the CPU load during your tests? Does it spike agressively?
Ans.Reset Pool statistics,couldnt find how to reset VS and HTTP Profile and hence updated VS.
To access the VS, TCP and HTTP statistics you may click on the "Statistics" button...
It will open the Statistics of the Virtual Server and the attached TCP and HTTP profiles (see Profile dropdown in the middle of the screen).
For troubleshooting purposes you may use two destinct TCP and/or HTTP profiles (same settings, just a different name) on your VS for client-side and server-side traffic. Then we could narrow down if the request failing at the client or server side and probably figure out a more deatiled reason for jmeters "meaningless errors".
Also: Please reply to the question of my initial post...
Do you see any abnormal logs in LTM? Things which only appear when load gets too high?
Cheers, Kai
Hi sand87ch ,
> try to change the Virtual server typr from standard (if it is standard) to performance layer 4 and remove any assigned http profiles.
this is only to identify where the issue exactly exist , by using performance layer 4 your connections should be faster and inspectedless via F5.
or > Take a Pcap by using (: P) modifier to see the connections on both (client/server) sides , I think you may find any error TCP packets shows there is latency within the traffic flow in "rate of 1K_10krpm ie., 10000 requests/min for 5 mins" state.
> I faced similar issue like this before , and I found the peer hop with F5 not stop sending {zero windows } packets which indicated that this peer hop can’t handel traffic in some cases.
Also
> reply for Kai_Wilke Questions which he recently sent , it would help much to identify your issue.
Regards- Heath_ParrottRet. Employee
"My Set up has a BIGIP single CPU hosted on AWS.This sits in front of a node API i use for load testing."
First issue is that 1 CPU is not a supported or recommend pattern to use, and per your statement that you are performing load testing. Please move to what would be a considered a supported pattern which would be a minimum of 2vCPU and 4 GB of RAM.
You have not listed the instance type that you are using but I am guessing that it is either a T2 or. T3 since you are on one CPU. Both of these instance classes operate on fraction or token use case for CPU and network bandwidth, additionally they have very small connection tables in AWS (connection tracking is enabled unless you are permitting 0.0.0.0/0 in and out in the SG). While you can flag them unlimited for CPU (option on the T2, standard on the T3) you cannot do so for network bandwidth. Once you have exhausted your network bucket you will see connection issues.
Prior to spending time debugging TCP what is happening please move to a minimum 2 vCPU and 4 GB of RAM deployment. If you are on a T2/T3 please change the instance type to a c5/c6/m5/m6.- sand87ch
I am using the F5 Big IP VE BYOL(14.xxx)livcense available in AWS marketplace.And yes the instance is T2 medium.Sorry that my posting confused you.By 1CPu i meant 1 boot location as shown in the attachment below.
The instance i am using is m5.xlarge having 4 cpu and 16GB ram.I hope this is ok.
- Heath_ParrottRet. Employee
Yes with BIG-IP running on an m5.xl 4CPU:16GB ram you should be good to load test as that configuration from a BIG-IP standpoint. The M5xl still has a connection table on the small side (WRT to the AWS SG - sorry AWS does not publicly publish these numbers) that you may be hitting and you should disable connection tracking to ensure that is not the issue. (see AWS documentation on how). I would recomend doing this if you have not since it is an external limit on the system that will not show up in the BIG-IP logs.
My expereince on hitting SG table limits plays out like:
Generate Traffic load --> Latency --> error. Let the test bed sit for 15 minutes and you can repeat at will. Repeating more frequently you hit the error sooner.
- sand87ch
Will changing the MTU help?
MTU
- Heath_ParrottRet. Employee
If it works with 1 request then MTU is unlikely. MTU issues and lack of functioning PMTUD normally manifest from the outset.
- sand87ch
Kai_Wilke Heath_Parrott Mohamed_Ahmed_Kansoh
So i did some further reading and did the following
Found out the max throughput on my license.This is as i mentioned earlier a trial license.The following script revealed the throughput allowed on my license
show /sys license detail | grep perf_VE_throughput_MbpsResult
perf_VE_throughput_Mbps [2]Now in the BIG IP LTM management screen i looked at the statistics Dashboard
Result:-
On running 10000req/min the throughput hits from anywhere between 2Mbps to 7Mbps.Gives errors as seen in attachments earlier.
On running 5000req/min the throughput hits from anywhere between 100Kbpsto 300Kbps.Doest show any error.
Please let me know if this is a valid finding for the issue i am facing.
Hi sand87ch,
Contact F5 sales specialists. They will send you 45-day eval keys for any VE you like to test.
Heath_Parrott showed you how to search for the "bandwith utilization" error messages in LTM log. I'm almost confident you will find some of those "exceeded" messages. And yes, those may explain the strange behaviour you see during the tests.
Cheers, Kai
- Heath_ParrottRet. Employee
All signs point to you are hitting the rate limit enforcer of the license.
Are you seeing anything in the logs on it?
show /sys log ltm |grep -i 'bandwidth utilizationTo run a load test you will need to use a system that would not be limited to to such a low value of network bandwidth.
Here is one from my labperf_VE_throughput_Mbps [25] admin@(ip-10-0-1-11)(pid-25975)(cfg-sync Standalone)(Active)(/Common)(tmos)#You may only have one TMM on the system (sorry I do not have the same license in my lab)
admin@(ip-10-0-1-11)(pid-25975)(cfg-sync Standalone)(Active)(/Common)(tmos)# show sys tmm-info | grep Sys::TMM
Sys::TMM: 0.0
Sys::TMM: 0.1
Sys::TMM: 0.2
Sys::TMM: 0.3
admin@(ip-10-0-1-11)(pid-25975)(cfg-sync Standalone)(Active)(/Common)(tmos)#
Running the command again without the grep would let you see which TMMs are being used during your tests
admin@(ip-10-0-1-11)(pid-26549)(cfg-sync Standalone)(Active)(/Common)(tmos)# show sys tmm-info

---------------------------
Sys::TMM: 0.0
---------------------------
Global
  TMM Process Id      18860
  Running TMM Id          0
  TMM Count               1
  CPU Id                  0

Memory (bytes)
  Total                5.1G
  Used               566.4M

CPU Usage Ratio (%)
  Last 5 Seconds          1
  Last 1 Minute           1
  Last 5 Minutes          1

--------------------------
Sys::TMM: 0.1
--------------------------
Global
  TMM Process Id     18860
  Running TMM Id         1
  TMM Count              1
  CPU Id                 1

Memory (bytes)
  Total                  0
  Used                   0

CPU Usage Ratio (%)
  Last 5 Seconds         1
  Last 1 Minute          1
  Last 5 Minutes         1

--------------------------
Sys::TMM: 0.2
--------------------------
Global
  TMM Process Id     18860
  Running TMM Id         2
  TMM Count              1
  CPU Id                 2

Memory (bytes)
  Total                  0
  Used                   0

CPU Usage Ratio (%)
  Last 5 Seconds         1
  Last 1 Minute          1
  Last 5 Minutes         1

--------------------------
Sys::TMM: 0.3
--------------------------
Global
  TMM Process Id     18860
  Running TMM Id         3
  TMM Count              1
  CPU Id                 3

Memory (bytes)
  Total                  0
  Used                   0

CPU Usage Ratio (%)
  Last 5 Seconds         1
  Last 1 Minute          1
  Last 5 Minutes         1

(END)

Help guide the future of your DevCentral Community!
What tools do you use to collaborate? (1min - anonymous)

Recent Discussions
Related Content
* Getting Started on DevCentral
* Community Guidelines
* Community Terms of Use / EULA
* Community Ranking Explained
* Community Resources
* Contact the DevCentral Team
* Update MFA on account.f5.com