Forum Discussion
 Cirrus
BigIP F5 LTM fails during Load testing
 MVP
MVPHi sand86ch,
Can you tell us the type of errors jmeter is reporting? During TCP connects, SSL handshakes, HTTP related timeouts, TCP reset after sending HTTP requests, bad HTTP responses?
Do you have the feeling to hit a certain hard limits, or is the error rate progressive?
How many TCP session do you use for the Test? What is your RTT between Client and F5. HTTP/2 or HTTP/1.1 tests?
You may explain your VS setup slightly to allow us to understand where bottlenecks could be happen? Using SNAT / SNAT Pools, using SSL-Offload, OneConnect?
Do you see any abnormal logs in LTM? Things which only appear when load gets too high?
Could you please reset your VS, HTTP profile and Pool statistics and share the results after a test is done?
Lets see if we could push you in the right direction to figure out your bottleneck...
Cheers, Kai
CirrusPlease find my answers below along with relevant screenshots.I hope my answers are satisfactory.
Can you tell us the type of errors jmeter is reporting? During TCP connects, SSL handshakes, HTTP related timeouts, TCP reset after sending HTTP requests, bad HTTP responses?
Ans. Dont see any error as such in jmeter.log.
Do you have the feeling to hit a certain hard limits, or is the error rate progressive?
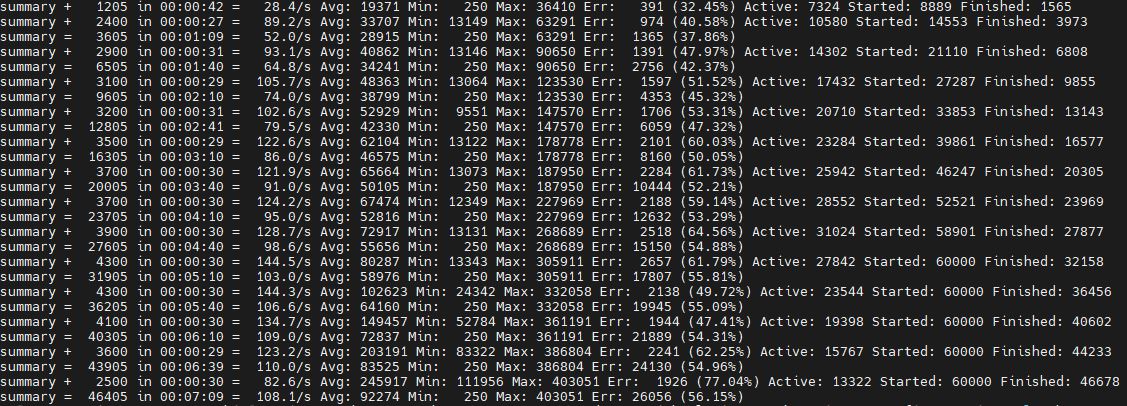
Ans.I feel the error is due to certain limits because the way i test is like the no of threads will be equal to the total number of requests that must be sent in 5 mins.eg. if its 10000/min then 50000 threads.I am able to say so because when i was sendind 1000req/min i.e., 5000/min i saw no errors.Please find the attachment for this.The error rate is progressive.
How many TCP session do you use for the Test? What is your RTT between Client and F5. HTTP/2 or HTTP/1.1 tests?
Ans .I dont know how to find out the number of tcp sessions while running the Jmeter test.The round trip time for a single postman call to my node(node js application) ranges between 2.32 to 2.50 secs.
You may explain your VS setup slightly to allow us to understand where bottlenecks could be happen? Using SNAT / SNAT Pools, using SSL-Offload, OneConnect?
Ans.Since this is a trial license and we are running on one CPU i havent configured SNAT / SNAT Pools, using SSL-Offload, OneConnect .My BIG IP LTM is hosted on an AWS ec2-instance which points to a pool consisting of the node(ec2-instance) having a node js application that is used for load testing.The requests made to this server has les size.This app responds with a response size as preferred.We control this via a parameter in our curl/postman call.
Could you please reset your VS, HTTP profile and Pool statistics and share the results after a test is done?
Ans.Reset Pool statistics,couldnt find how to reset VS and HTTP Profile and hence updated VS.
- Kai_WilkeDec 06, 2022
> Ans. Dont see any error as such in jmeter.log.
Log information are indeed not that helpful to figure out the cause of the err 😞
> Ans.I feel the error is due to certain limits because the way i test is like the no of threads will be equal to the total number of requests that must be sent in 5 mins.eg. if its 10000/min then 50000 threads.I am able to say so because when i was sendind 1000req/min i.e., 5000/min i saw no errors.Please find the attachment for this.The error rate is progressive.
I assume a single thread opens a single TCP connection from your client to the F5 and just sends a single request to the F5. The F5 will then open for each client side TCP connection a unique server side TCP connection. Unless you exceed 64k concurrent connections (limitation if not using SNAT pools) you should not hit a well known hard limit. Seems to be a pure load specific issue then...
> Ans .I dont know how to find out the number of tcp sessions while running the Jmeter test.The round trip time for a single postman call to my node(node js application) ranges between 2.32 to 2.50 secs.
See answer above. If using a single TCP connection for each request the response time should not matter.
Ans.Since this is a trial license and we are running on one CPU i havent configured SNAT / SNAT Pools, using SSL-Offload, OneConnect .My BIG IP LTM is hosted on an AWS ec2-instance which points to a pool consisting of the node(ec2-instance) having a node js application that is used for load testing.The requests made to this server has les size.This app responds with a response size as preferred.We control this via a parameter in our curl/postman call.
Can you please provide screenshoot of the VS configuration? Gray out sensible information as needed.
Did you checked the CPU load during your tests? Does it spike agressively?
Ans.Reset Pool statistics,couldnt find how to reset VS and HTTP Profile and hence updated VS.
To access the VS, TCP and HTTP statistics you may click on the "Statistics" button...
It will open the Statistics of the Virtual Server and the attached TCP and HTTP profiles (see Profile dropdown in the middle of the screen).
For troubleshooting purposes you may use two destinct TCP and/or HTTP profiles (same settings, just a different name) on your VS for client-side and server-side traffic. Then we could narrow down if the request failing at the client or server side and probably figure out a more deatiled reason for jmeters "meaningless errors".
Also: Please reply to the question of my initial post...
Do you see any abnormal logs in LTM? Things which only appear when load gets too high?
Cheers, Kai
 sand87chDec 06, 2022
Do you see any abnormal logs in LTM? Things which only appear when load gets too high?
Ans.I looked at the system and audit logs but there are many.I tried clearing them using
/etc/init.d/syslog-ng stop

rm -f /var/log/ltm

/etc/init.d/syslog-ng start
However the system and audit logs dont seem to be removed(only the local traffic logs get removed).Any way to remove these logs as well.I did log in via putty and check var/log/ltm but it has a lot of log listings and i didnt wanrt to mess up the set up at this juncture by deleting any log listed.Any way to identify just the system and audit logs and remove them?
- Kai_WilkeDec 06, 2022
Hi Sand87ch,
you could flush your logs via SSH.
[itacs@kw-f5-dev:Active:Standalone] / # > /var/log/ltm
[itacs@kw-f5-dev:Active:Standalone] / # > /var/log/audit
[itacs@kw-f5-dev:Active:Standalone] / # > /var/log/messages
Instead of flushing those logs, you could just use tail your ltm log during your tests to see what happens...
[itacs@kw-f5-dev:Active:Standalone] / # tail -f /var/log/ltmIf the default logs wont give you a clue whats happening, you may turn on TCP-RST logging and repeat the test again...
Configuring the BIG-IP system to log TCP RST packets (f5.com)
Cheers, Kai


Recent Discussions
Related Content
* Getting Started on DevCentral
* Community Guidelines
* Community Terms of Use / EULA
* Community Ranking Explained
* Community Resources
* Contact the DevCentral Team
* Update MFA on account.f5.com