logs
33 Topics
PHONEHOME: Update Server unavailable
Recently i have started seeing this error. What is this about? If F5 checking for updates then how to check which server its connecting etc and where are the proper place to check logs I found following logs in Logs > LTM Tue Oct 6 04:03:10 EDT 2015infolbf5updatecheck[12466] PHONEHOME: Update Server unavailable1.5KViews0likes7Comments
Logs for local-db-publisher
We are running the DNS module on a dedicated box. We have DNS log publisher set to the "local-db-publisher" - however, we are not certain where these logs are located. DNS log queries and log responses are both enabled. I have found some articles that mention that the logs can be found in /var/log/gtm and some that state they are found in /var/log/ltm but the queries and responses are nowhere to be found. Suggestions?Solved1.4KViews0likes6Comments
Is it possible to set multiple IPs in the Source IP Address of the advanced ASM Event log search?
Hi, I want to exclude a couple IPs from the event logs I am looking at. I can set the drop down to 'is not' for the Source IP field and enter one IP address, removing this one IP from the event logs I am searching. Is there an operator or something similar that I can use to separate multiple IPs to remove more than one IP from the event logs? Thank You. Kind Regards Chris1.2KViews0likes2Comments
F5 health check logs no response or bad response
Hello Guys, Would like to ask regarding the health check. so we have client wanted to know if our node wasnt able to reply or it did reply but a bad response. so this is the logs sample: 01070638:5: Pool /Common/ member /Common/server_name:443 monitor status down. [ /Common/: down; last error: /Common/: Unable to connect; No successful responses received before deadline. @2016/12/01 09:58:35. ] [ was up for 22hrs:39mins:24sec ] Thanks!943Views0likes1CommentLog separation by event
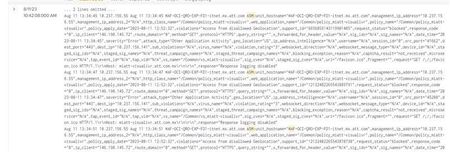
Los logs waf se están enviando a un SIEM, pero al momento de registrarlos, está registrando más de un evento por sección, este acto provoca que se pierda información ya que al juntarse tantos eventos se convierte en una cadena muy grande y provoca que comiencen a saltar líneas, como se muestra en la imagen. Por eso el cliente me pide que los separe para evento, ¿alguien sabe si hay solución?Solved803Views0likes2CommentsTroubleshooting and logs
Hello, i am trying to build environment for one project. For now i got the first step configured - an app which i need to use with F5 is Keycloak, one www app and xmpp chat. For now, i do not really know what else should i use via f5, only loadbalance of access to keycloak is done. I am using SSL/TLS communication and can log in to keycloak website using f5 as load balancer. I will be trying to understand how this environment is working now, and will try to determine what should i use via F5. But what is a little problematic for me is to: 1. find a good articles about configuration f5 - for example simple load balancing with ssl/tls etc step by step - and this is the first question, how do You search for configuration steps of something? 2. second and important thing is - how to troubleshoot and check logs for this kind of communication - please share with me some siple, good written articles. For example, for now i would lik eto check via logs every steps of my communication which is working, i do not really know how and where. i saw this article Troubleshooting BIG-IP - The Basics | DevCentral - but it is overall info without examples. Thank You for Your advices. Best way would be to understand this logs, if i got knowledge how and what can i find this way i would be able to determine, what configuration i am missing, if something is comunicating properly etc. Thanks for the help.799Views0likes5Comments
Event log soap[22458]
Hello, I try to understand a log message on our F5 Big IP 13.1.1.4. Under System -> Logs -> Local Traffic, I have several entries like LogLevel:info Service:soap[22458] Event:src=127.0.0.1, user= I precise there is nothing after user :) Anyone can explain me what it means and if it is possible to filter these entries? Best regards.717Views0likes3Comments
Health Monitor logs not showing up
We have health monitor attached to pool member on F5-LTM version 15.1.2. A health monitor reports the status of a pool. So whenever any pool member goes down, ideally it should get logged. But I am unable to view the health monitor logs on the F5. Only when the 'Pool' goes down or comes back up, as shown below, such log messages appear. Oct 1 07:43:53 TD-F5 err tmm[11722]: 01010028:3: No members available for pool /Common/internal_nexus-lab_pool Oct 1 07:47:27 TD-F5 notice tmm1[11722]: 01010221:5: Pool /Common/internal_nexus-lab_pool now has available members But, the health monitor logs are missing. I am looking for logs that indicate when a health monitor marks pool members as down or up, something like this: Sep 19 03:30:43 TD-F5 notice mcpd[7077]: 01070638:5: Pool /Common/internal_dev_pool member /Common/10.8.16.111:9002 monitor status down. [ /Common/tcp: down ] [ was up for 46hrs:43mins:1sec ] Sep 27 05:18:24 TD-F5 notice mcpd[7077]: 01070727:5: Pool /Common/internal_dev_pool member /Common/10.8.17.2:80 monitor status up. [ /Common/tcp: up ] [ was down for 244hrs:27mins:15sec ] Such log messages do not seem to be appear in the logs. I tried to view the logs using CLI as well as GUI. Can anyone help to understand how to obtain these logs or if I am missing something?700Views0likes1Comment