application delivery
43355 TopicsAutomatic Certificate Management with ACMEv2 in F5 BIG-IP
One of the most anticipated features of F5 BIG-IP is integration with ACMEv2. With the General Availability of BIG-IP 21.1.0 on May/26, this feature came into being. In this tutorial, we are going to configure it, using Let's Encrypt as the CA. The domain for which we are generating/renewing certificates is carlosf5lab.lat. The official docs for this feature are located in SSL Certificate Management | BIG-IP Documentation. Pre-requisite 1: DNS Resolver that can reach the internet (at least the CA endpoints). In this case, we are using the native DNS Resolver that comes with BIG-IP. Pre-requisite 2: The internal proxy that will make the connection with the CA. Pre-requisite 3: a self signed SSL certificate that the ACMEv2 protocol uses as the identifier for a device account. You don't have to fill the Subject Alternative Name. For the Common Name, an e-mail contact is advised. Now, we are going to create the ACME Provider object. Give it a name, and select the internal proxy previously created. For the CA Certificate to enable the secure connection with the Directory URL, you can use the default ca-bundle.crt. The Directory URL is the endpoint for the ACMEv2 protocol. In Let's Encrypt case, it is https://acme-v02.api.letsencrypt.org/directory For the Account Key, choose the previously created self-signed certificate. For the trickier part of all, the field "Contacts" is mandatory, and it must be an URL. That’s why you must use the format mailto:email_address. Check the Terms and Conditions, and the Create Account boxes. After a while, the Account Status must read as "Valid". To prove you own the domain whose certificate Let's Encrypt is going to create/renew, it must be pointing to an IP (A Record) where you must have your Virtual Server listening on Port 80 configured to respond to the ACMEv2 Challenge. (In this specific lab, the domain carlosf5lab.lat points to a Public IP mapped to an internal IP). Now you can order your first certificate via ACMEv2 on BIG-IP: After a while, the Key tab should read something like: Which means your certificate was generated: To track the ACME Provider, you can check its statistics: That's it, my friend! If it helped you, give a thumbs up to this post!2KViews7likes12Comments
New rSeries Tenant Gui slow
We have deployed a new Tenant on new r4000 series appliances and have have noticed that the gui is extremely slow and will timeout occasionally. The Tenant has 8vCPU's and 32 GB of Ram, the dashboard shows everything is very low but switching from one gui section to another will result in the "Loading Retrieving ...." page for a bit. I have found articles that you can increase the memory that tomcat has but have not made any changes on that. The resource provisioning is set to small which is the same as our existing vCMP devices on iSeries appliances. At this point the new device has not been added to the device group/config sync so it doesn't have any of the VIPs/Pools/Health Monitors and is still running slow. Anyone else experience this behavior? Thanks, Joe53Views0likes2CommentsThe State Of HTTP/2 Full Proxy With F5 LTM
In this article, I will attempt to summarize the known challenges of an HTTP/2 full proxy setup, point out possible solutions, and document known bugs and incompatibilities. Most major browsers had added HTTP/2 support by the end of 2015. However, I hardly ever see F5 LTM setups with HTTP/2 full proxy configured.2.4KViews6likes15CommentsRate limiting based on X-forwarded-For
Hello, Currently our external BIG-IP receive traffic from CloudFlare. I would like to apply a rate limit on the IP provided by X-FORWARDED-FOR header. Aside from building an iRule, is there any bulit-in option inside of F5 modules to achieve this? the use case is to rate limit for OTP submission and im scared that an iRule will have high load on the resources. Thanks in advance.58Views0likes1CommentKong API Gateway and BIG-IP on OpenShift
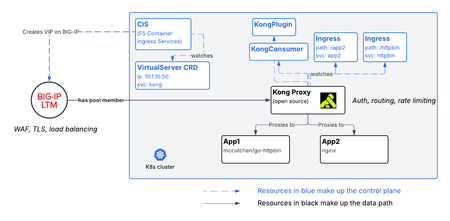
This article outlines the control plane and data plane for a BIG-IP + Kong API Gateway architecture. BIG-IP controls TLS termination, WAF, and ingress to cluster, and Kong performs rate limiting, authentication, and routing to endpoints.138Views2likes2Comments
Strengthening your Digital Trust through F5’s Certificate Lifecycle Management partner ecosystem
In modern multi-cloud architectures, the F5 BIG-IP Application Delivery Controller (ADC) sits at the critical intersection of network traffic, application delivery, and security. Whether handling SSL/TLS offloading, inspecting encrypted traffic for threats, or enforcing Zero Trust access policies, a robust public key infrastructure (PKI) is part of nearly every enterprise BIG-IP deployment. However, as encryption levels approach 100% across enterprise traffic and industry standards push for significantly shorter certificate lifespans (such as 47-day validity limits), manually managing digital certificates and protecting private keys is no longer sustainable. A single expired certificate or compromised private key can lead to catastrophic application downtime, lost revenue, and severe compliance violations. The SSL/TLS Management Challenge within Enterprise Architectures As organizations scale their deployments across physical appliances (iSeries, rSeries, VELOS), virtual editions (VE), and public cloud instances, managing cryptographic assets introduces distinct operational challenges: Certificate Expiration & Unplanned Downtime: With hundreds or thousands of Client SSL and Server SSL profiles across multiple BIG-IP clusters, tracking expiration dates manually via spreadsheets inevitably leads to outages. Private Key Sprawl & Exposure: Storing high-value private keys in software files increases exposure to software vulnerabilities, unauthorized access, and side-channel attacks. Compliance Requirements: Industry mandates like PCI DSS, HIPAA, and FIPS 140-2/3 demand stringent controls around key generation, storage, and access auditing. Operational Overhead: Generating Certificate Signing Requests (CSRs), importing intermediate chain bundles, and binding certificates to SSL profiles across large fleets consume valuable engineering time. To address these hurdles, F5 integrates with leading security partners to offer end-to-end protection for keys and automated management for certificates. Each of these partners offer a complete SSL/PKI solution, and have built functionality specific to managing the certificates and keys that reside on the BIG-IP. Although full functionality amongst our partners may differ from vendor to vendor, at the foundation they all provide a way to manage the lifecycle of the certificates that reside on the BIG-IP. By making use of the BIG-IP's REST API, their management frameworks securely discover, catalog, rotate, and provision certificates on the BIG-IP, ensuring that Enterprises escape the challenges mentioned above. There are quite a few vendors offering CLM management for the BIG-IP. In alphabetical order, here are the ones that actively partner with F5 to provide this functionality. The CLM Partners in our ecosystem: AppViewX As an F5 partner for over a decade, AppViewX offers complete BIG-IP and NGINX system automation and management platform that includes CLM through their AVX ADC solution. For those opting for a standalone CLM solution (without the platform management) from AppViewX, AppviewX AVX One fits the bill. Guidance for configuring the AppViewX system to support BIG-IP can be found here. CyberArk Offering their CLM solution for BIG-IP as a self-hosted or SaaS offering, customers have choice in which model to adopt when leveraging CyberArk's Next-Generation Trust Security (NGTS) for BIG-IP. Guidance for configuring the CyberArk solution for BIG-IP can be found here. DigiCert Through DigiCert's "F5 BIG-IP LTM connector", the DigiCert® Trust Lifecycle Manager can not only offer full lifecycle management of BIG-IP, but it also offers certificate discovery and import as well. Guidance for configuring the DigiCert solution for BIG-IP can be found here. Encryption Consulting One of our newer partnerships, Encryption Consulting has extended their CertSecure Manager solution to offer CLM support for F5, focusing on BIG-IP & SSL Orchestrator solutions. Guidance for configuring the Encryption Consulting solution for BIG-IP can be found here. Entrust The Entrust nShield Connect HSMs works with BIG-IP systems to provide FIPS-certified protection of SSL certificates and encryption/decryption keys. The nShield architecture includes a Remote File System (RFS) that stores and manages the encrypted key files, supporting BIG-IP platforms including the Local Traffic Manager (LTM), the Domain Name System (DNS) – formerly Global Traffic Manager (GTM), the VIPRION Series, and the BIG-IP Virtual Edition (VE). Guidance for configuring the Entrust nShield HSM solution for BIG-IP can be found here. KeyFactor With a focus on F5 BIG-IP, BIG-IQ, & WAF, Keyfactor has exended their Certificate Lifecycle Automation platform to support F5 through their "F5 Orchestrator" plugin for Keyfactor Command Guidance for configuring the KeyFactor Orchestrator solution for BIG-IP can be found here. Sectigo Built using F5's Kojot ACME client, Sectigo offers full certificate lifecycle management for BIG-IP ADSP platforms through the Sectigo Certificate Manager (SCM) platform. Guidance for configuring the Sectigo solution for BIG-IP can be found here. Thales Thales Luna HSM solution includes full BIG-IP CLM support that lives within their larger SSL/PKI infrastructure solution. Guidance for configuring the Sectigo solution for BIG-IP can be found here. 51Views1like0Comments
Beginner in F5 ASM
Hi All, I hope you are doing well. I am currently learning about F5 ASM to add one more technical skill to my skill set. I already have good experience with firewalls (Palo Alto and Check Point) As F5 ASM is not deployed in our environment and we use a different vendor WAF (Imperva) I wanted to know what the normal procedure is to onboard a web application on F5 in production. Which policy template do you choose (Rapid deployment, comprehensive, fundamental) Also, what is the best practice for policy building in learning mode? How are signatures enforced? After 7 days learning period, do you enforce all staging signatures learned or do some manual checks as well?146Views0likes3CommentsAdding new rSeries Tenant to existing Device Group
We are refreshing our iSeries with rSeries hardware. I have deployed the new Tenant for LTM and associated the proper VLANs and I see them in the new LTM but they are all in the Common Partition. On the existing LTM's the VLANS are in their respective partitions. I have case open with support and they provided guidance on adding the new device to the group to get the configuration synced. Can I get any suggestions from anyone that has already gone through this exercise? I have a change request in for tonight to add this device to the group and I am concerned with the process. Thanks, Joe101Views1like4CommentsObserving F5 BIG-IP CNE CNFs - V2 Metrics Aggregation walkthrough
Introduction Cloud-native distribution solves scale and resilience, but it fragments visibility. When TMM pods run across multiple Kubernetes nodes, logs and metrics scatter with them. The observer pod exists to pull that telemetry back into a single, coherent view. In a CNF deployment, multiple TMM pods run across Kubernetes nodes, each handling separate traffic slices. A coherent view of the entire dataplane requires aggregating those per-pod statistics. CNFs generate stats at high frequency across all TMM pods. Without aggregation, per-pod metric streams multiply quickly and do not compose cleanly into useful dashboard or alerting data. if you upgraded recently to CNF2.2+ you may have encountered new metrics behavior where, that's what we are covering here how V2 metrics change the metric collection and troubleshooting behavior. TODA Architecture: Four Components TODA (Telemetry, Observability, Diagnostics, and Analytics) is the stats collection and aggregation layer for CNFs. The distributed model has four roles: Component Description TMM Scraper Sidecar container in each TMM pod. Replaces tmstatsd. Serves metrics from tmctl over a gRPC response stream when requested by a Receiver. Receiver Runs as a StatefulSet. Scrapes metrics from assigned TMM Scrapers, persists them, and forwards to the Observer over gRPC with mutual TLS (mTLS). Handles metrics from terminated TMM pods so cumulative data is not lost mid-scrape. Observer Runs as a StatefulSet. The aggregation engine. Pulls from Receivers, aggregates metrics across all TMMs per table, and exports to the OTEL collector. Emits internal telemetry covering gRPC call metrics, aggregation performance, and storage state. Operator Runs as a Deployment. Orchestrates lifecycle: discovers TMM Scrapers, Receivers, and Observers; load-balances TMMs across Receivers; applies aggregation mode and collection interval settings via a ConfigMap. V1 vs. V2 CNF Metrics Choose before deploying. V1 and V2 use incompatible metric naming in Prometheus, so PromQL queries written for one will not work on the other. V1 (legacy): tmstatsd runs in each TMM pod and streams metrics directly to OTEL with no aggregation. Metric names look like: virtual_server_stat/spk-app-1-spk-app-tcp-8050-f5ing-testapp-virtual-server/clientside.bytes_out Each metric carries a tmmID attribute identifying the source pod. Six TMM pods means six separate data streams for the same virtual server. Dashboards scale poorly. V2 (current): The Receiver and Observer aggregate before export to OTEL. The equivalent metric: f5.virtual_server.clientside.received.bytes Attributes include f5.virtual_server.name, k8s.namespace.name, and observer.job.mode: aggregated. One metric, unified across all TMMs, with naming aligned to OpenTelemetry semantic conventions. Use V2 for new deployments. V1 remains only for environments not yet migrated. Deploying the Observer with Helm Install the Observer in the same namespace as your F5Ingress. Get the chart version from your CNFs software package: cd cnfinstall ls -1 tar | grep observer # f5-toda-observer-v4.56.4-0.0.15.tgz Create an observer_values.yaml. At minimum, set the image registry and storage class: image: repository: your-registry.example.com persistence: storageClassName: '' accessMode: ReadWriteOnce size: 3Gi platformType: robin fluentbit_sidecar: image: repository: your-registry.example.com fluentbit: tls: enabled: true fluentd: host: f5-toda-fluentd.cnf-gateway.svc.cluster.local. Install: helm install observer f5-toda-observer-<VERSION>.tgz -f observer_values.yaml Note: The Operator and Receivers share a volume. If they run on the same node, any StorageClass works. If Receivers are distributed across multiple nodes, use a ReadWriteMany-compatible StorageClass, NFS is the standard choice. In my lab I'm installing to a cne-core namespace instead of default namespace. Also, Make sure to update BIG-IP Controller ingress values, as below f5-tmm: ... ... observer: enabled: true image: repository: local.registry.com f5-toda-logging: enabled: true type: stdout fluentd: host: f5-toda-fluentd.cne-core.svc.cluster.local. tmstats: enabled: false Once updated upgrade your helm installation helm upgrade f5ingress f5ingress-v15.82.0-0.2.50.tgz -f deployment/values-ingress-v2.yaml -n cnf-fw-01 Now, you have all the components ready, you can reference the below steps for additional integrations with Grafana and Prometheus. Lab notes In my lab there are some commands I had to run to adjust to the openshift deployment, helm upgrade observer f5-toda-observer-5.22.10-0.2.4.tgz -n cne-core --reuse-values --set persistence.storageClassName=openebs-hostpath oc adm policy add-scc-to-user hostmount-anyuid -z f5-observer -n cne-core oc adm policy add-scc-to-user hostmount-anyuid -z f5-observer-operator -n cne-core oc adm policy add-scc-to-user hostmount-anyuid -z f5-observer-receiver -n cne-core oc secrets link f5-observer <secret> --for=pull -n cne-core oc secrets link f5-observer-operator <secret> --for=pull -n cne-core oc secrets link f5-observer-receiver <secret> --for=pull -n cne-core Wiring Prometheus and Grafana to CNF Metrics The OTEL collector exposes a Prometheus-compatible endpoint on TCP port 9090. It requires mTLS, so valid certificates must be in place before the scrape job succeeds. Step 1 — Create a Prometheus namespace and certificate: kubectl create namespace prometheus kubectl apply -f prom-certs.yaml # cert-manager Certificate manifest Step 2 — Configure Prometheus to scrape OTEL with TLS: serverFiles: prometheus.yml: scrape_configs: - job_name: bnk-otel scheme: https static_configs: - targets: - otel-collector-svc.default.svc.cluster.local:9090 tls_config: cert_file: /etc/prometheus/certs/tls.crt key_file: /etc/prometheus/certs/tls.key ca_file: /etc/prometheus/certs/ca.crt insecure_skip_verify: false server: extraVolumes: - name: prometheus-tls secret: secretName: prometheus-client-secret extraVolumeMounts: - name: prometheus-tls mountPath: /etc/prometheus/certs readOnly: true global: scrape_interval: 10s service: type: NodePort nodePort: 31929 persistentVolume: enabled: false Step 3 — Deploy via Helm: helm install prometheus oci://ghcr.io/prometheus-community/charts/prometheus \ -n prometheus --atomic -f values.yaml //Update otel config map and change line 47 to following debug: verbosity: detailed //Then add following at the end of the configmap exporters: - otlp - deb Step 4 — Verify the scrape target is healthy: curl http://<node-ip>:31929/api/v1/targets | jq Step 5 — List all CNF metrics currently ingested: curl http://<node-ip>:31929/api/v1/label/__name__/values | jq Step 6 — Run a quick query to validate data is flowing: curl "http://<node-ip>:31929/api/v1/query?query=f5_tmm_f5_pool_member_serverside_connections_count_total" | jq For Grafana, add Prometheus as a data source. F5 provides a pre-built Observer dashboard JSON on CloudDocs. The dashboard has three sections: gRPC metrics — Communication performance between Observer containers: call latency and request counts. Go Runtime metrics — Pod resource consumption: goroutine counts, heap memory, object allocation rates. Storage/Aggregation metrics — How the Observer handles dead TMM pod data. When a TMM pod terminates, the Observer runs merge operations to consolidate its metrics. This section shows whether those operations are healthy. Note, you need to update your OTEL definition to include the below //Update otel config map debug: verbosity: detailed //Then add following at the end of the configmap exporters: - otlp - deb //Apply updated OTEL configmap Once done, proceed to rollout the otel deployment oc rollout restart deployment otel-collector -n cnf-fw-01 oc logs otel-collector-6b5c9d5f89-qccqv -f | grep profile_tcp -> table: Str(profile_tcp_stat) -> table: Str(profile_tcp_stat) -> table: Str(profile_tcp_stat) -> table: Str(profile_tcp_stat) -> table: Str(profile_tcp_stat) -> table: Str(profile_tcp_stat) -> table: Str(profile_tcp_stat) -> table: Str(profile_tcp_stat) -> Name: f5.profile_tcp.accepts -> f5.profile_tcp.name: Str(tmstat_tcp) -> f5.profile_tcp.vs_name: Str(qkview_for_tmstatsd) -> observer.job.name: Str(cnf-fw-01/default-scrape-template-66456f74c4/default-job-profile_tcp_stat) -> Name: f5.profile_tcp.accepts -> f5.profile_tcp.name: Str(_mcptcp) -> f5.profile_tcp.vs_name: Str(grpc_mt_10:2) -> observer.job.name: Str(cnf-fw-01/default-scrape-template-66456f74c4/default-job-profile_tcp_stat) -> Name: f5.profile_tcp.accepts -> f5.profile_tcp.name: Str(_mcptcp) -> f5.profile_tcp.vs_name: Str(grpc_mt_4:0) -> observer.job.name: Str(cnf-fw-01/default-scrape-template-66456f74c4/default-job-profile_tcp_stat) -> Name: f5.profile_tcp.accepts -> f5.profile_tcp.name: Str(_mcptcp) -> f5.profile_tcp.vs_name: Str(_grpc_tmm_listener_9) -> observer.job.name: Str(cnf-fw-01/default-scrape-template-66456f74c4/default-job-profile_tcp_stat) -> Name: f5.profile_tcp.accepts -> f5.profile_tcp.name: Str(_cgctcp_in) Troubleshooting via Metrics V2 Now, we have better capabilities of actually monitoring traffic across multiple pods and TMMs from single location, [cloud-user@ocp-provisioner f5-cne-2.2.0]$ oc exec sts/f5-observer-receiver -n cne-core -- mdb --list | grep "/cnf-fw-01/" Defaulted container "f5-observer-receiver" out of: f5-observer-receiver, fluentbit 2026/07/15 18:12:09 INFO dialing to observer addr=0.0.0.0:8088 f5-log-ID=0612007a cnf-fw-01/tmm/f5-tmm-fcc888779-w98zh:f5-tmm:ae28ae8bf4ecb2de9f9a1d0674fb47f8acb2eab1bb46727e285e2cbcae87266b/cnf-fw-01/fw_context_stat 2026-07-15 18:11:22 763 cnf-fw-01/tmm/f5-tmm-fcc888779-w98zh:f5-tmm:ae28ae8bf4ecb2de9f9a1d0674fb47f8acb2eab1bb46727e285e2cbcae87266b/cnf-fw-01/virtual_server_stat 2026-07-15 18:11:22 3101 cnf-fw-01/tmm/f5-tmm-fcc888779-w98zh:f5-tmm:ae28ae8bf4ecb2de9f9a1d0674fb47f8acb2eab1bb46727e285e2cbcae87266b/cnf-fw-01/dns_cache_resolver_stat 2026-07-15 18:11:22 5162 cnf-fw-01/tmm/f5-tmm-fcc888779-w98zh:f5-tmm:ae28ae8bf4ecb2de9f9a1d0674fb47f8acb2eab1bb46727e285e2cbcae87266b/cnf-fw-01/profile_dns_stat 2026-07-15 18:11:22 7500 cnf-fw-01/tmm/f5-tmm-fcc888779-w98zh:f5-tmm:ae28ae8bf4ecb2de9f9a1d0674fb47f8acb2eab1bb46727e285e2cbcae87266b/cnf-fw-01/profile_tcp_stat 2026-07-15 18:11:22 972 cnf-fw-01/tmm/f5-tmm-fcc888779-w98zh:f5-tmm:ae28ae8bf4ecb2de9f9a1d0674fb47f8acb2eab1bb46727e285e2cbcae87266b/cnf-fw-01/pool_member_stat 2026-07-15 18:11:22 2156 cnf-fw-01/tmm/f5-tmm-fcc888779-w98zh:f5-tmm:ae28ae8bf4ecb2de9f9a1d0674fb47f8acb2eab1bb46727e285e2cbcae87266b/cnf-fw-01/fw_rule_stat 2026-07-15 18:11:22 1588 cnf-fw-01/tmm/f5-tmm-fcc888779-w98zh:f5-tmm:ae28ae8bf4ecb2de9f9a1d0674fb47f8acb2eab1bb46727e285e2cbcae87266b/cnf-fw-01/dos_stat 2026-07-15 18:11:22 3828 cnf-fw-01/tmm/f5-tmm-fcc888779-w98zh:f5-tmm:ae28ae8bf4ecb2de9f9a1d0674fb47f8acb2eab1bb46727e285e2cbcae87266b/cnf-fw-01/fw_container_stat 2026-07-15 18:11:22 1213 Now, let's have a closer look at one of the segments, below is the FW context [cloud-user@ocp-provisioner f5-cne-2.2.0]$ oc exec sts/f5-observer-receiver -n cne-core -- mdb --segment cnf-fw-01/tmm/f5-tmm-fcc888779-w98zh:f5-tmm:ae28ae8bf4ecb2de9f9a1d0674fb47f8acb2eab1bb46727e285e2cbcae87266b/cnf-fw-01/fw_context_stat Defaulted container "f5-observer-receiver" out of: f5-observer-receiver, fluentbit 2026/07/15 18:12:49 INFO dialing to observer addr=0.0.0.0:8088 f5-log-ID=0612007a -----BEGIN RESOURCE----- Meta: Name: fw_context_stat Unit: Annotations: k8s.namespace.name: cnf-fw-01 Labels: f5.firewall.context.context_name: cnf-fw-01-forwarding-any-virtual-server-SecureContext_vs f5.firewall.context.context_type: virtual f5.firewall.context.policy_type: 1 TTL: 0s Value: [2428 0 0 0] -----END RESOURCE----- Now, let's have a look at the virtual servers stats [cloud-user@ocp-provisioner f5-cne-2.2.0]$ oc exec sts/f5-observer-receiver -n cne-core -- mdb --segment cnf-fw-01/tmm/f5-tmm-fcc888779-w98zh:f5-tmm:ae28ae8bf4ecb2de9f9a1d0674fb47f8acb2eab1bb46727e285e2cbcae87266b/cnf-fw-01/virtual_server_stat Defaulted container "f5-observer-receiver" out of: f5-observer-receiver, fluentbit 2026/07/15 18:14:24 INFO dialing to observer addr=0.0.0.0:8088 f5-log-ID=0612007a -----BEGIN RESOURCE----- Meta: Name: virtual_server_stat Unit: Annotations: k8s.namespace.name: cnf-fw-01 Labels: f5.virtual_server.destination: 0.0.0.0 f5.virtual_server.name: cnf-fw-01-forwarding-any-virtual-server-SecureContext_vs f5.virtual_server.source: 0.0.0.0 TTL: 0s Value: [1844667 108023672 0 4 28282 69732 2542 0 0 0 0 108023672 1844587 0 4 69732 28280 2542] -----END RESOURCE----- -----BEGIN RESOURCE----- Meta: Name: virtual_server_stat Unit: Annotations: k8s.namespace.name: cnf-fw-01 Labels: f5.virtual_server.destination: 10.1.20.100 f5.virtual_server.name: cnf-fw-01-cnf-dohapp-virtual_server f5.virtual_server.source: 0.0.0.0 TTL: 0s Value: [0 0 0 0 0 0 0 0 0 0 0 0 0 0 0 0 0 0] -----END RESOURCE----- -----BEGIN RESOURCE----- Meta: Name: virtual_server_stat Unit: Annotations: k8s.namespace.name: cnf-fw-01 Labels: f5.virtual_server.destination: 10.1.30.100 f5.virtual_server.name: cnf-fw-01-dnsx-app-listener-virtual_server f5.virtual_server.source: 0.0.0.0 TTL: 0s Value: [0 0 0 0 0 0 0 0 0 0 0 0 0 0 0 0 0 0] -----END RESOURCE----- With Observer you have aggregated observer receiver to monitor and observe your CNF deployment. Conclusion As a conclusion, why would you go to V2 metrics vs V1, there are four pain points with V1 in distributed environments: Stream count; One virtual server across six TMM pods gives you six independent metric series in Prometheus, same stat, six rows, differentiated only by tmmID. That's not an observability system. That's a spreadsheet you have to reassemble manually every time you open Grafana. Data loss; A pod gets evicted mid-scrape and its cumulative counters are gone. The Receiver in the TODA pipeline holds that data in a local volume and merges it before export. Your charts stay clean. PromQL tax; In V1, every panel needs a sum() by (virtual_server) wrapper or the numbers are wrong. Not approximately wrong, it's wrong by a factor of N. V2 aggregates inside the pipeline, at the Observer, before the metric ever reaches Prometheus. One series. Use it directly. The naming; V1 embeds the VS name in the metric path. That's not how Prometheus is supposed to work, and everything downstream, like alerting rules, federation, label matchers fight it. V2 puts the VS identity where it belongs: as an attribute, f5.virtual_server.name. Short metric name, proper labels, and PromQL that actually reads like PromQL. The TODA pipeline ( TMM Scraper, Receiver, Observer ) exists specifically to close the visibility gap. The Receiver is the persistence layer. The Observer is the aggregation engine. Together they turn N pod streams into one coherent signal. If you take one thing from this: aggregation has to happen somewhere. In V1, it happens in your head, on every dashboard panel, every time. In V2, it happens in the pipeline, once, before the data leaves the cluster. That's the whole difference. Related Resources Distributed TODA for Stats Aggregation CNFs Event Logs Performance Visualization (Prometheus + Grafana) OTEL Statistics Reference CNF Log Formats Reference Debug Sidecar Overview Troubleshooting Common Errors 102Views3likes0Comments
Per ip connection limit on virtual server
i want to apply per ip connection limit on a virtual server . i have AFM provisioned on the F5 . the requirement is that, example - any client IP address can open TOTAL max of 50 connections . meaning per ip connection limit on 50. How can i achieve this . Thanks107Views0likes5Comments