Running Wireshark captures from F5 BIG-IP
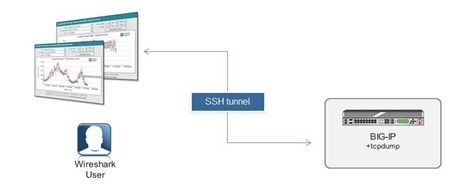
My colleague, Simon Kowallik, recently posted something really cool to our internal message boards. It started with the question: “Have you ever wanted to run captures with Wireshark on BIG-IP?” Answer: Yes, for like twelve years I wanted to do this! In the post below, Simon shows us how to use the packet tracing tool Wireshark (or any other tool that reads pcaps from tcpdump) directly with BIG-IP using only some slight of hand. Anyway, I thought this was so awesome that it deserved wider audience so here it is, republished with Simon’s permission. Have fun! Posted by Simon Kowallik in on Jul 7, 2013 9:02:38 AM We actually can do that without installing X, wireshark and hundreds of libraries on BIG-IP. Which is not an option anyway. 🙂 There are a few things we need: SSH access to the BIG-IP, bash or tmsh is fine Proper SSH client on our Desktop, eg. OpenSSH or alternatives (putty & plink) The trick is to launch an ssh session without a login shell and run tcpdump through it on the remote system making tcpdump write raw packets to STDOUT while piping it to our local wireshark reading from STDIN. Here are two examples: cygwin on Windows # ssh -l root 192.168.1.245 "tcpdump -w - -s0 -pi 0.0 tcp or udp or icmp" | /cygdrive/c/Program\ Files/Wireshark/Wireshark.exe -k -i - Linux # ssh -l root 192.168.1.245 "tcpdump -w - -s0 -pi 0.0 tcp or udp or icmp" | /usr/bin/wireshark -k -i - Windows CMD with plink (download from putty homepage): plink.exe -l root -pw default 192.168.1.245 "tcpdump -w - -s0 -pi 0.0 tcp or udp or icmp" | "c:\Program Files\Wireshark\wireshark.exe" -k -i - I think you can figure out how it works. If not, here are a few hints: Tcpdump's option -w with - as an argument writes to STDOUT instead of a file Wireshark's -i option reads from an interface, - as an argument makes STDIN the interface. STDIN/STDOUT is represented by - on most platforms. Caveats Tcpdump does buffer the output when writing to a file (our STDOUT in our case), which unfortunately means it might take some time until we can see the traffic in wireshark. Tcpdump offers options to influence the buffering however this is not implemented in our version of Libpcap (tested on 11.4HF1). This is especially annoying if we want to capture low volume traffic. What we could do is capturing icmp echo requests+replies additionally to the traffic we are interested in, and remove them again with the wireshark display filter. Then start a ping to push the interesting packets to wireshark faster. Words of warning You are piping the whole packet capture through ssh, so make sure you define your tcpdump filter reasonable, otherwise bad things might happen. Connect with David: Connect with F5:3.5KViews0likes14CommentsThe Core Addendum: CTF Walkthrough
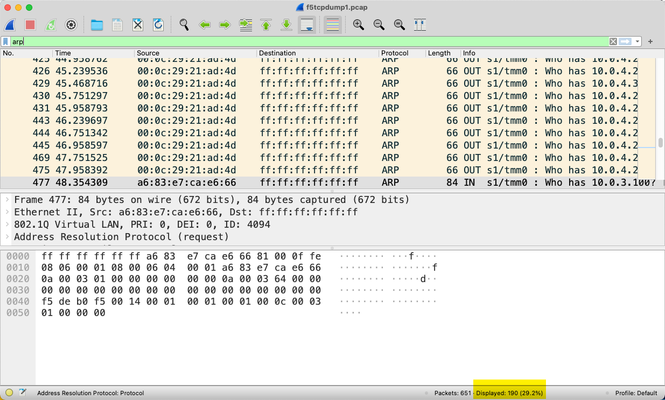
On the debut of my new show The Core on Tuesday, I got to share a few, but not all of the Wireshark exercises I had planned. In honor of Cybersecurity Awareness Month, I thought it appropriate to frame the activity in a capture the flag (CTF) format as is often offered at security conferences and increasingly as well through online learning platforms. All the exercises, my approach to solving them, and the answers are below. I worked from two packet captures from my local test BIG-IP system. Task 1.A - How many arp requests for 10.0.3.100? My approach to most tasks is to start with a wide net and work toward the narrow. So for this first one, I apply a generic arp filter. I could count from there, as you can see that there is at least one matching in packet 477, but instead, I can narrow the filter to the arp destination of the IP asked for. And with that, I have a final answer for this task of 5. Task 1.B - How many ping requests? For this task, following directions is necessary, as the request is for ping requests, not all pings. There could be even more icmp traffic at any given time, but this capture only has the request/response types. Our task is request only, which has an icmp type of 8. Final answer: 7 Task 1.C - How many multicast DNS queries for an "Elgato Key Light Air"? Wrapping up the first task focus, this can be accomplished one of two ways, with a generic mdns protocol filter or the dns.qry.name filter and then the contains operator for that string. Both results are the same, and the final answer here is 13. Task 2 - What’s the MAC address for the IP host 10.0.4.20? This one is pretty straight forward as well. I just need to find the IP address with the ip.addr filter and match the IP as source or destination to the MAC address, but this can be refined to ip.dst or ip.src so I only need to consider one. I use ip.dst in this case. Final answer: the mac address is 00:0c:29:b4:5c:90. Task 3 - What are the resolved names for the 00:0c:29:21:ad:4d and ff:ff:ff:ff:ff:ff MAC addresses? If you look atthe images above in Task 1A, you'll notice that the MAC addresses in the Source/Destination columns are raw. To enable name resolution, I need to change the preferences in Wireshark. And now I can see the resolved MAC names. Final answer: resolved MAC names are VMware_21:ad:4d and Broadcast (duh...), respectively. Task 4.A - What percentage of packets in the capture are handled by TMM0? This task is our first look at using the f5ethtrailer filter list, incorporating the f5ethtrailer.tmm filter. Note that in Wireshark versions of yesteryear you had to compile this into a custom Wireshark build yourself. But from v2.6+, it's included and at least in my latest version, also enabled by default. Final answer: 77.1% of the packets in this capture are handled by TMM0. Task 4.B - What number of packets are handled by TMM1? This task only needs an adjustment of the tmm number. I included it just for the purpose of being attentive to what's asked. When you're in a competition, sometimes you only get one attempt to answer, so make sure you don't fall into the trap of providing the information in the wrong format. Final answer: 148 packets. Task 5 - For a traffic flow to ip 10.0.4.20 on port 8081, what’s the request verb and the value of the X-Server-Disabled header in the response? This one I combine two filters, ip.addr and tcp.port 8081 to find the flow or flows for this address/port pair and then look at the TCP stream of the first flow and hope for the best. That selection reveals the text-based flow of HTTP messages in this TCP flow. Final answer: request verb is HEAD and the X-Server-Disabled header value is true. Task 6 - What’s the BIG-IP version and tcpdump command that was run to generate this packet capture This has an easy cheat in that you just need to look at the first packet in the capture, but the goal is to identify the filter f5fileinfo.cmdline. Final answer: BIG-IP version is 15.1.2.1 (build 0.0.10) and the tcpdump command was "-ni 0.0 -w /var/tmp/f5tcpdump1.pcap -s0". Note that even though I didn't specify even the low F5 details in this capture that a limited subset of that information is provided anyway, such as the BIG-IP system info shown here as well as the TMM core shown in tasks above. Task 7 - Limit the capture to only tcp ports 80, 443, 8080, 8081 OR tcp resets? This task is an easy grab from the same filter as in task 6, but I wanted to make mention of the difference of capture filters and display filters. Capture filters reduce the number of packets that a) the system has to log, reducing the impact to system performance during capture and b) the analyst has to comb through and process. These are both net positives with the assumption that you are not restricting the capture past the point where you lose the necessary data to properly capture the problem you're trying to find and solve. Display filters are only limiting what you are looking at after the capture is already taken. The data set itself is not changed. Final answer: The capture filter is ‘(tcp[13] & 4!=0) or (tcp port 80 or 443 or 8080 or 8081)’. Note that the TCP flags are in offset byte 13 in the TCP header, and the RST flag is in the 2**2 position (or 4) of the byte. Also note in that tcpdump command the --f5 n,ssl:v. More on that later. Task 8 - How many GET requests can you see against tcp port 443 This is another multi-filter combination, using http and tcp.port. Hmmm, that seems fishy..or does it? Would you expect to see HTTP traffic in cleartext to TCP port 443, which is normally SSL traffic and thus encrypted? Interesting. The final answer, for now, is 0. Task 9 - How do we decrypt the HTTPS traffic and once done, repeat task 8? In task 7 I noted the --f5 ssl flag on the tcpdump. When you enable the database key tcpdump.sslproviderand use that flag when taking a capture, the key material will be included in your capture (WARNING!! Do not share/store this file without understanding the repercussions!) so you can decrypt the traffic for analysis. On the Wireshark side since I did include this in this second capture, I use the f5ethtrailer.keylog filter to find all the keylog entries, which need to be copied out of the capture to a file and then referenced back in the Wireshark settings. I show one below, but note that all should be done to make the whole capture decrypted. This can be done auto-magically with tshark as shown at the bottom of this lab document on Clouddocs. I take that value and copy it into a file (and the other entries as well, but just showing this one for brevity). Then I open Wireshark's preferences and select protocols and then TLS and select that file. And now I'll repeat task 8. And BINGO! Final answer: 5 GET requests. Task 10 - What are the virtual server names for the destinations 10.0.3.50:80 and 10.0.3.50:443, respectively? For this final task in this CTF walkthrough, I'll need the f5ethtrailer.vip filter to narrow down the packets I need to reference, and then a combination as well of ip.dst and tcp.port filters. First, port 80. And secondly port 443. Final answer: /Common/testvip for port 80, /Common/nerdlife_ssl_vip for port 443. Conclusion And there we have it! A successful journey through a variety of tasks analyzing a couple BIG-IP packet captures. As I mentioned during the show, I had a teacher in a packet analysis 20 years ago who encouraged 15 minutes a day looking at captures to keep those skills sharp. I didn't, and he was right. Use it or lose, people!2.3KViews0likes2Comments
SSL Forward Proxy Explained using Wireshark
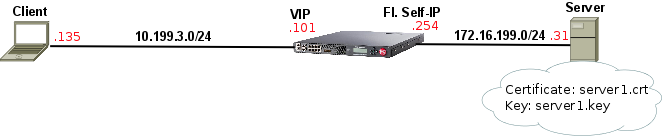
Related articles:SSL Legacy Renegotiation vs Secure Renegotiation Explained using Wireshark Summary The idea behind this feature is to allow BIG-IP to sniff into SSL connections to any Internet destination that goes through it whilst preserving client's trust of the destination. When this feature is enabled, BIG-IP uses a pre-installed CA set underproxy-ca-cert(CA Certificatein the GUI) that is also trusted by client's browser and BIG-IP pretends to be the Internet destination by re-signing SSL certificates on the fly with the aforementioned CA and using public key from CA configured undercerton BIG-IP. The client trusts the connection and is unaware of BIG-IP's presence. The most common use case isSecure Web Gateway(SWG), although neither APM nor SWG are needed to deploy SSL Forward Proxy functionality.LTM is enough. Lab Scenario Lab test results: Client opens connection with BIG-IP and sendsClient Hello. BIG-IP immediately opens connection with web server and completes SSL handshake. BIG-IP creates unique certificate with following information and sends it over viaServer Hello: Serial number: random Issuer: copied fromdefault.crt Validity: notBefore (copied fromserver1.crt), notAfter: 30 days counting from time it was generated (configurable viacert-lifespanorCertificate Lifespanin the GUI) Subject: copied fromserver1.crt Public Key: copied fromltm2.CA.crt All X.509extensionsallowed incert-extensions-includeare also copied fromserver1.crtto unique custom certificate Client-side handshake completes successfully using above dynamically generated custom certificate just created by BIG-IPand data exchange works as expected. How SSL Forward Proxy works on Wireshark Actual capture used for below explanation is attached to this article below (and heressl-forward-sample-3.pcap ) Upon Client Hello sent by Client BIG-IP rushes to open new connection and completes server-side SSL handshake: Server-side handshake completes on frames 17-18 and and BIG-IP immediately resumes and completes Client-side handshake.Note:The reason why BIG-IP waits for server-side handshake to complete first is because BIG-IP uses server-side certificate information to generate acustomcertificate that will be sent to Client on client-side. The most interesting bit here is BIG-IP'sCertificatemessage sent on frame 20 to Client as it contains the customCertificate generated by BIG-IP: We can see there are 2 Certificates: CA Certificate(proxy-ca-cert) is the Certificate Authority (CA) that signs the newly created custom certificate and is supposed to be trusted by Client to confirm BIG-IP's custom (dynamically generated) certificate can be trusted too. We can immediately work out that the 2nd certificate isdefault.crtjust by matching its serial number which is unique for each issuer: However, the first certificate looked a mystery to me until I found where all the pieces came from. The serial number looks randomly generated to me as it doesn't match (not even close to any of the certificates above): The Issuer field, which shows information about who signed the certificate, shows thatdefault.crtwas the one who signed BIG-IP's custom certificate: Certificate generation date (notBefore) is copied fromserver1.crtbut expiry date (notAfter) is calculated based oncert-lifespan(Certificate Lifespanin the GUI) which by default is 30 days added to time custom certificate was generated: Subject fields, which shows information about the current certificate, is copied and identical to information onserver1.crt: And finally, the public key is copied fromcertfield (ltm2CA.crt). Notice they are the same: That's enough information for now.2.7KViews1like2CommentsUnderstanding HTTP/2 Profile's Frame Size option on BIG-IP
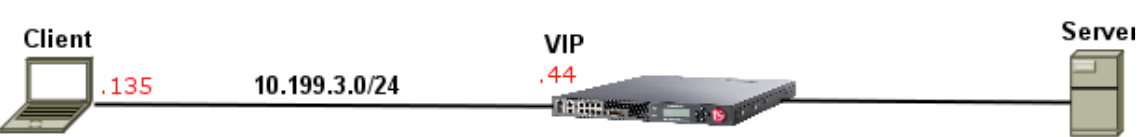
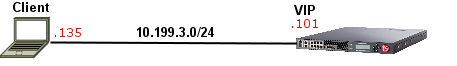
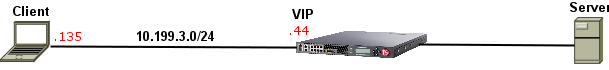
Quick Intro The Overview of the BIG-IP HTTP/2 profile article on AskF5 I created a while ago describes all the HTTP/2 profile options but sometimes we need to test things out ourselves to grasp things at a deeper level. In this article, I'm going to show how Frame Size option sets specifically only the maximum size of HTTP/2 DATA message's payload in bytes and what happens when we change this value on Wireshark. Think of it as a quick walkthrough to give us a deeper understanding of how HTTP/2 works as we go through. The Topology It's literally a client on 10.199.3.135 and a virtual server with HTTP + HTTP/2 profile applied with the default settings: Testing Frame Size Option Here I've tried to modify frame-size to an invalid value so we can see the valid range: Let's set the frame-size to 1024 bytes: I have curl installed in my client machine and this is the command I used: If we just filter for http2 on Wireshark, we should see the negotiation phase (SETTINGS) as well as request (GET) and response (200 OK) headers in their specific message type (HEADERS). However, our focus here is on DATA message type as seen below: I've now added a new column (Length) to include the length of DATA messages so we can easily see how Frame Size settings affect DATA length. Here's how we create such filter: I've further renamed it to HTTP2 DATA Length but you've got the point. If we list only DATA messages, we can see that the payload of HTTP/2 DATA message type will not go beyond 1024 bytes: Wireshark confirms that HTTP/2 headers + DATA payload of frame 26 is 1033 bytes but DATA payload-only is 1024 bytes as seen below: We can then confirm that only payload counts for frame-size configuration on BIG-IP. I hope you enjoyed the above hands-on walk-through.932Views1like0CommentsTCP Internals: 3-way Handshake and Sequence Numbers Explained
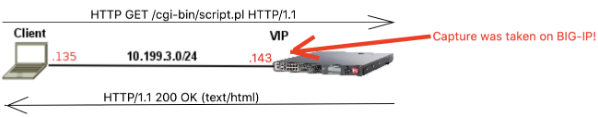
In this article, I will explain and show you what really happens during a TCP 3-way handshake as captured by tcpdump tool. We'll go deeper into details of TCP 3-way handshake (SYN, SYN/ACK and ACK) and how Sequence Numbers and Acknowledgement Numbers actually work. Moreover, I'll also briefly explain using real data how TCP Receive Window and Maximum Segment Size play an important role in TCP connection. As a side note, I will not touchTCP SACKandTCP Timestampsthis time as they should be covered in a future article about TCP retransmissions. FYI, the TCP capture was generated by a simpleHTTP GETrequest to BIG-IP to get hold of a file on/cgi-bin/directory calledscript.plusingHTTP/1.1protocol: BIG-IP then responds withHTTP/1.1 200 OKwith the requested data. This is not very relevant as we'll be looking at TCP layer but it's good to understand the capture's context to fully understand what's going on. This is what a TCP 3-way handshake looks like on Wireshark: Aswe can see, the first 3 packets are exchanged less than 1 second apart from each other. TheIN/OUTportion ofInfofield on BIG-IP's capture tells us if the packet is coming IN or being sent OUT by BIG-IP (as capture was taken on BIG-IP). As this is a slightly more in-depth explanation of TCP internals, I am assuming you know at least what a TCP 3-way handshake is conceptually. The TCP SYN, SYN/ACK and ACK Segments We can see that first packet is[SYN], second one is[SYN/ACK]and last one is[SYN/ACK]as displayed on Wireshark. TheInfosection as a whole only shows the summary of the most relevant fields copied from the TCP header. It is just enough to make us understand the context of the TCP segment. Let's now have a look what these fields mean with the exception ofSACK_PERMandTSval. When we double click on the[SYN]packet below, we find the same information again in the actual TCP header: The most important thing to understand here is that[SYN],[SYN/ACK]and[ACK]are all part of theFlagsheader above. They're just 1's and 0's. WhenSYNflag is enabled (i.e its value is 1), the receiving end (in this case BIG-IP) should automatically understand that someone (my client PC in this case) is trying to establish aTCPconnection. The response from BIG-IP (SYN/ACK) is an acknowledgement to theSYNpacket and therefore it has bothSYNandACKflags set to 1. Client's last response is just anACKas seen below: As per RFC, both sides should now assume a TCP connection is established. For plain-textHTTP/1.1protocol, there should now be a GET request in another layer as a payload of (or encapsulated by) TCP layer. If our traffic it is protected byTLSthenTLSlayer should come first as the payload of TCP layer and HTTP would be the payload of TLS layer. Does it make sense? That's how things work in the real world. TCP Sequence numbers A side note,Wireshark shows that our first SYN segment's Sequence number is 0 (Seq=0): It also shows that it isrelativesequence numberbut this is not the real TCP sequence number. Wireshark automatically zeroes it for you to make it easier to visualise and/or troubleshoot. In reality, the real sequence number is a much longer number that is calculated by your OS using current time and other random parameters for security purposes. This is how we see the real sequence number in Wireshark: Now back to business. Some people say if Client sends a TCP segment to BIG-IP, BIG-IP's ACK should be client's sequence number + 1 right? Wrong! Instead of +1 it should be+ number of bytes last received from peer or +1 if SYN or FIN segments. To clarify, here's thefull Flow Graphof our capture using relativesequence numbersto make it easier to grasp (.135= Client and .143 =BIG-IP): On 4th segment above (PSH, ACK - Len: 93), client sends TCP segment withSeq = 1and TCP payload data length (comprised of HTTP layer) of93 bytes. In this case, BIG-IP's response isnotACK = 2 (1 + 1) as some might think. Instead, BIG-IP responds with whatever client's last Sequence number wasplusnumber of bytes last received. As last sequence number was 1 and client also sent a TCP payload of 93 bytes, thenACKis 94! This is the most important concept to grasp for understanding sequence numbers and ACKs. SEQsandACKsonly increment whenthere is a TCP payload involved(by the number of bytes). SYN, FIN or ZeroWindow segments count as 1 byte for SEQs/ACKs. I added a full analysis using real TCPSEQs/ACKsto anAppendixsection if you'd like to go deeper into it. For the moment let's shift our attention towardsTCP Receive Window. TCP Receive Window and Maximum Segment Size (MSS) During 3-way handshake, the Receive Window (Window size valueon Wireshark) tells each side of the connection the maximum receiving buffer in bytes each side can handle: So it's literally like this (read red lines first please): [1]→ Hey, BIG-IP! My receiving buffer size is 29200 bytes. That means, you caninitiallysend me up to 29200 bytes before you even bother waiting for an ACK from me to send further data. [2]→ This should be the same as[1], unless Window Scale TCP Option is active. Window Scale should be the subject of a different article but I briefly touch it on[3]. [3]→ Original TCP Window Size field is limited to 16 bits so maximum buffer size is just65,535 bytes which is too little for today's speedy connections. This option extends the 16-bit window to 32-bit window but because BIG-IP did not advertise Window Scale option for this connection, it is disabled as both sides must support it for it to be used. [4]→ Hey, client! My receiving buffer size is 4380 bytes. That means, you caninitiallysend me up to 4328 bytesbefore you even bother waiting for an ACK from me to send further data. The reason why the wordinitiallyisunderlined on [1] and [3] is because Window size typically changes during the connection. For example, client's initial window size is 29200 bytes, right? This means that if it receives 200 bytes from BIG-IP it should go down to 2900 bytes. Easy, eh? But that's not whatalwayshappens in real life. In fact, in our capture it's the opposite! Bytes in flightcolumn shows the data BIG-IP (*.143) is sending in bytes to our client (*.135) that has not yet been acknowledged. I've added a column withWindow Size valueto make it easier to spot how variable this field is: It is the OS TCP Flow control implementation that dictates theReceive Windowsize taking into account the current "health" of its TCP stack and of course your configuration. Yes, in many cases, especially in the middle of a connection, the Window Size does decrease based on amount of data received/buffered so our first explanation also makes sense! How does BIG-IP know that client has freed up it's buffer again? As we can see above, when Client ACKs the receipt of BIG-IP's data, it also informs the size of its buffer in theWindow Size valuefield. That's how BIG-IP knows how much data it can send to Client before it receives another ACK. What about the Maximum Segment Size? Each side also displays aTCP Option - Maximum Segment sizeof 1460 bytes. This informs the maximum size of the TCP payload each side can send at a time (per TCP segment). Looking at the picture above, BIG-IP sent 334 bytes of TCP payload to client, right? In theory, this could've been up to 1460 bytes as it's also within client's initial buffer of 29200 bytes. So apart from informing each other about the maximum buffer, the maximum size of TCP segment is also informed. TCP Len vs Bytes in Flight Column (BIF) If we look at our last picture, we can see that whatever is inLenfield matches what's in ourBIFcolumn, right? Are they the same? No! Lenshows the current size of TCP payload (excluding the size of TCP header). Remember that TCP payload in this case is the whole HTTP portion that our TCP segment is carrying. Bytes in flightis not really part of TCP header but that's something Wireshark adds to make it easier for us to troubleshoot. It just means the number of bytes sent that have not yet been acknowledged by receiver. In our capture, data is acknowledged immediately so bothLenandBIFare the same. I've picked a different capture here where there are 3 TCP segments sent with no acknowledgement soBIFcolumn increments for each unacknowledged data segment but goes back to zero as soon as anACKis received by receiver: Notice thatBIFvalues now differ from TCP payload (the equivalent toLeninInfocolumn). That's it for now. The next article would be about TCP retransmission. Appendix - Going in depth into TCP sequence numbers! Here's a full explanation about what actually takes place on TCP layer from the point of view of BIG-IP: Just follow along from [1] to [10]. That's it.8.3KViews3likes1CommentUnderstanding IPSec IKEv2 negotiation on Wireshark
Related Articles: Understanding IPSec IKEv1 negotiation on Wireshark 1 The Big Picture There are just 4 messages: Summary: IKE_SA_INIT: negotiate security parameters to protect the next 2 messages (IKE_AUTH) Also creates a seed key (known as SKEYSEED) where further keys are produced: SK_e (encryption): computed for each direction (one for outbound and one for inbound) to encrypt IKE_AUTH messages SK_a (authentication): computed for each direction (one for outbound and one for inbound) to hash (using HMAC) IKE_AUTH messages SK_d (derivation): handed to IPSec to generate encryption and optionally authentication keys for production traffic IKE_AUTH: negotiates security parameters to protect production traffic (CHILD_SA) More specifically, the IPSec protocol used (ESP or AH - typically ESP as AH doesn't support encryption),the Encryption algorithm (AES128? AES256?) and Authentication algorithm (HMAC_SHA256? HMAC_SHA384?). 2 IKE_SA_INIT First the Initiator sends aSecurity Association—>Proposal—>Transform,Transform... payloads which contains the required security settings to protectIKE_AUTHphase as well as to generate the seed key (SK_d) for production traffic (child SA): In this case here the Initiator only sent one option for Encryption, Integrity, Pseudo-Random Function (PRF) and Diffie Hellman group so there are only 4 corresponding transforms but there could be more. Responder picked the 4 available security options also confirmed inSecurity Association—>Proposal—>Transform,Transform… payloads as seen above. 3 IKE_AUTH These are immediately applied to next 2IKE_AUTHmessages as seen below: The above payload is Encrypted using SK_e and Integrity-protected using SK_a (these keys are different for each direction). The firstIKE_AUTHmessage negotiates the security parameters for production traffic (child SAs), authenticates each side and informs what is the source/destination IP/Port that is supposed to go through IPSec tunnel: Now, lastIKE_AUTHmessage sent by Responder confirms which security parameters it picked (Security Associationmessage), repeats the sameTraffic Selectormessages (if correctly configured) and sends hash of message using pre-master key (Authenticationmessage) Note that I highlighted 2 Notify messages. TheINITIAL_CONTACTsignals to Initiator that this is the onlyIKE_SAcurrently active between these peers and if there is any otherIKE_SAit should be terminated in favour of this one. TheSET_WINDOW_SIZEis a flow control mechanism introduced in IKEv2 that allows the other side to send as many outstanding requests as the other peer wants within the window size without receiving any message acknowledging the receipt. From now on, if additional CHILD_SAs are needed, a message calledCREATE_CHILD_SAcan be used to establish additional CHILD_SAs It can also be used to rekeyIKE_SAwhereNotificationpayload is sent of typeREKEY_SAfollowed byCREATE_CHILD_SAwith new key information so new SA is established and old one is subsequently deleted.20KViews3likes0CommentsExploring Kubernetes API using Wireshark part 2: Namespaces
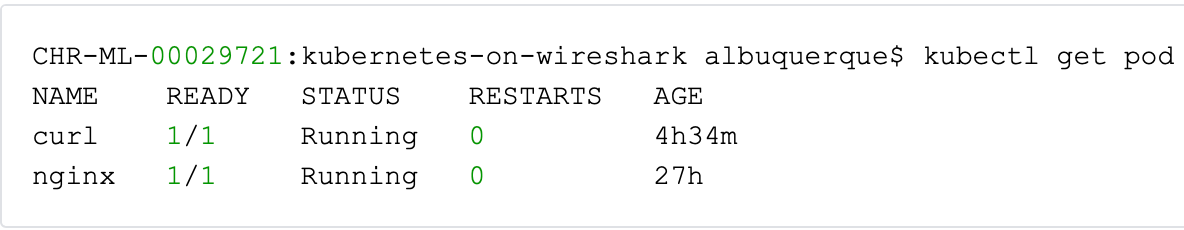
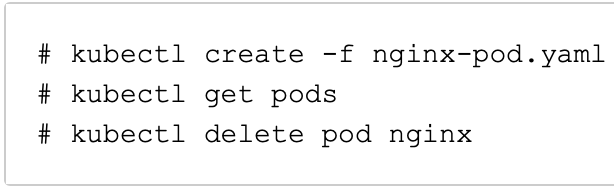
Related Articles: Exploring Kubernetes API using Wireshark part 1: Creating, Listing and Deleting Pods Exploring Kubernetes API using Wireshark part 3: Python Client API Quick Intro Using kubectl command is pretty useful: When you execute the above command, kubectl sends a GET request to /api/v1/namespaces/default/pods: Kubernetes master node replies with a JSON file containing all pods (along with their info) that belong to namespace 'default'. In this article, I'm going to explain what Kubernetes namespaces are by showing you real HTTP traffic reaching Kubernetes master node. I've removed the TLS complexity by using proxy so we can just focus on HTTP headers only. Understanding namespaces Initially, I'd say just memorise that /api/v1 is like the root directory of Kubernetes master node's API where client is going to retrieve all sorts of information. Have you noticed thenamespacesin /api/v1/namespaces/default/pods? defaultjust happens to be the namespace that our pods listed here belong to. Think of namespaces for Kubernetes as virtual Kubernetes clusters just like Virtual Machines (VMs) for OS. We can have identical objects with same name that belong to different namespaces and therefore are isolated from each other from the point of view of the API. Creating a new custom namespace I can create a new namespace like this usingkubectlcommand: I can then create the same identical pods from default namespace inrodrigo's namespace. Let's see what happened under the hood when I typed the above command. When we create a new namespace, kubectl sends an HTTP POST request Kubernetes master node: pcap: creating-rodrigo-namespace.pcap Thekubectlclient then sends a JSON file like this in the POST request: Then, Kubernetes Master responds withHTTP 201 Createdmessage and another JSON file with all newly creatednamespace's info: I've described some of the JSON info that came back from API just out of curiosity. Note that many different objects are 'namespaced', i.e. they belong to a namespace. Others like nodes are namespace-independent. I used pods as an example here to explain namespaces as pods are most popular and well-known object in Kubernetes world. Keeping 2 identical pods in 2 namespaces Let me create a new NGINX pod in the new namespace: Ops! We need to specify that we're creating the same pod in the new namespace we've just created, otherwise it defaults to default namespace where thenginxpod already exists: It now worked. Let's list only pods from rodrigo's namespace only with kubectl: When we capture the above request on Wireshark, we now see that our GET request to Kubernetes Master now usesrodrigo's namespace so we're now listing only pods fromrodrigonamespace only: We also have this same exact pod using same name indefaultnamespace. Remember? Deleting my custom namespace Now, let's delete our pod: And that's the API call under the hood (an HTTP DELETE request to complete path of namespace - just like we're deleting a folder): pcap: deleting-namespace.pcap Listing pods from all namespaces If you're curious about how the URL would look like when we list pods from all namespaces with kubectl: The answer is this: This request will list all pods from all namespaces. Troubleshooting Namespaces Remember I mentioned thefinalizerattribute? When I was creating this article and I tried to delete the my custom namespace (rodrigo), it got stuck in Terminating state: Initially I thought it was just Google Cloud slowness but 40 minutes? That's a lot. So I suspected it could be because offinalizeattribute and googled it sofound that it was a bugand here's the solution: Retrieve namespace's JSON declaration to temporary file: Deletekuberneteskeyword fromfinalizersattribute: Now send a PUT request to API and the JSON file above: Then, when I looked back it was finally gone:940Views1like0CommentsExploring Kubernetes API using Wireshark part 1: Creating, Listing and Deleting Pods
Related Articles: Exploring Kubernetes API using Wireshark part 2: Namespaces Exploring Kubernetes API using Wireshark part 3: Python Client API Quick Intro This article answers the following question: What happens when we create, list and delete pods under the hood? More specifically on the wire. I used these 3 commands: I'll show you on Wireshark the communication between kubectl client and master node (API) for each of the above commands. I used a proxy so we don't have to worry about TLS layer and focus on HTTP only. Creating NGINX pod pcap:creating_pod.pcap (use http filter on Wireshark) Here's our YAML file: Here's how we create this pod: Here's what we see on Wireshark: Behind the scenes, kubectl command sent an HTTP POST with our YAML file converted to JSON but notice the same thing was sent (kind, apiVersion, metadata, spec): You can even expand it if you want to but I didn't to keep it short. Then, Kubernetes master (API) responds with HTTP 201 Created to confirm our pod has been created: Notice that master node replies with similar data with the additional status column because after pod is created it's supposed to have a status too. Listing Pods pcap:listing_pods.pcap (use http filter on Wireshark) When we list pods, kubectl just sends a HTTP GET request instead of POST because we don't need to submit any data apart from headers: This is the full GET request: And here's the HTTP 200 OK with JSON file that contains all information about all pods from default's namespace: I just wanted to emphasise that when you list a pod the resource type that comes back isPodListand when we created our pod it was justPod. Remember? The other thing I'd like to point out is that all of your pods' information should be listed underitems. Allkubectldoes is to display some of the API's info in a humanly readable way. Deleting NGINX pod pcap:deleting_pod.pcap (use http filter on Wireshark) Behind the scenes, we're just sending an HTTP DELETE to Kubernetes master: Also notice that the pod's name is also included in the URI: /api/v1/namespaces/default/pods/nginx← this is pods' name HTTP DELETEjust likeHTTP GETis pretty straightforward: Our master node replies with HTTP 200 OK as well as some json file with all the info about the pod, including about it's termination: It's also good to emphasise here that when our pod is deleted, master node returns JSON file with all information available about the pod. I highlighted some interesting info. For example, resource type is now just Pod (not PodList when we're just listing our pods).4.5KViews3likes0CommentsSSL Legacy Renegotiation vs Secure Renegotiation Explained using Wireshark
Related articles: SSL Forward Proxy Explained using Wireshark Quick Intro This is just a quick but in-depth look into SSL/TLS Renegotation and Secure Renegotiation. I'll just quickly show you how legacy and secure negotiation work in TLS/SSL. Renegotiation takes place in the same TCP connection. Do not confuse with Session Resumption/Reuse which takes place in subsequent TCP connections. Here's the topology I used to test this: 1. Legacy Renegotiation First there is a full SSL handshake: Notice that on Frame 6 (Server Hello) BIG-IP offers a Session ID: However, we do not use this session ID in renegotiation. Why? Because renegotiation means we want torenegotiate security parameters again and reusing session ID we would be reusing the same security parameters. Also,renegotiation takes place over the same TCP connection, so if client is the one that starts renegotiation we see a straightClient Hellostill over the same connection aboveand full handshake takes place: If it's BIG-IP (server-side) who is willing to trigger renegotiation then we see aHello Requestmessage still over same TCP connection followed by full handshake: That's it. This is legacy Renegotiation. Note:Do not confuse Renegotiation with Session Reuse/Resumption. In Session Reuse a new TCP connection is open and Client sends a Session ID from a previous session so that same security parameters are reused. 2. Secure Renegotiation - The Add on! Secure renegotiation is exactly the same as above with the addition of SSLrenegotiation_infoextension described inRFC5746. Note:The only reason for this extension is to avoid man-in-the-middle attack where session is hijacked and attacker tries to renegotiate new session using client's handshake information. This extension saves some information from initial handshake that must be provided upon renegotiation which attacker wouldn't have. If we click on first Client Hello we seerenegotiation_infoextension along with other extensions inClient Hellomessage: Note:Instead of renegotiation_info extension there is also the option to add TLS_EMPTY_RENEGOTIATION_INFO_SCSV to Cipher Suites list and that means the same thing, i.e. we (or client/server) support Secure Renegotiation. First message is always blank just to indicate Client supports Secure Renegotiation. Server also signals its support inServer Hello: At the end of every SSL handshake there is aFinishedmessage sent by both Client and BIG-IP: If we click on Finished message from Client, more specifically onVerify Datafield (assuming it is decrypted) we will see a 12 bytes hash in hexadecimal: This client-sidehash(d5 b7 01 35 b3 d2 d7 2a 54 0e 24 f0) is the result of hash of all handshake messages exchanged at this point mixed with previously negotiated master secret and a mathematical function to make it more secure (random). This allows BIG-IP to validate the integrity of the entire handshake. In BIG-IP's Finished message we can also see the sameVerify Datamessage which its own hash which in turn will also allow client to validate the integrity of the entire handshake: But why is it important to know that? Because in the next handshake,renegotiation_info (foundwithinClient Hellosent by Client)containsVerify Dataportion it sent in previousFinishedmessage (from previous handshake). Then BIG-IP sends its hash concatenated with client inVerify Dataportion. Therefore, it is unlikely an attacker could have obtained these values becauseFinishedmessage is always encrypted. Let's confirm values match onrenegotiation_infoon Client Hello sent afterwards in the same TCP connection (frame 1931): On BIG-IP's side it is the concatenation of Client's Verify Data and BIG-IP's Verify data (frame1965): That's it.6.7KViews1like1CommentHTTP/2 Protocol in Plain English using Wireshark
1. Quick Intro Some people find it easier to do a "test drive" first to learn how a new protocol works in its simplest form and only then read the RFC. It turns out Wireshark is a perfect tool for me to do just that. It's a simple test and here's the topology: I'll just issue a HEAD request and later on a GET request and we'll see how it looks like on Wireshark. For more info about HTTP/2 profile and HTTP/2 protocol itself you can read the article I published onAskF5andJason's DevCentral article: What is HTTP Part X - HTTP/2. 2. Confirmation of which protocol will be used The packet capture taken below was the result of the following curl command issued from my ubuntu Linux client (I could've used a browser instead): Note: 10.199.3.44 is my virtual server with HTTP/2 profile applied. Here's packet capture (in case you want to follow along): http2-test-v1.zip HTTP/2 is negotiated during SSL handshake in Application Layer Protocol Negotiation (RFC 7301) SSL extension like this: Client says which protocol(s) it supports and server responds whichone it picked (in this case it's HTTP/2!). 3. Negotiation of HTTP/2 Parameters Think of it as something that has to take place like Client Hello and Server Hello in SSL for example. Server side (BIG-IP in this case) sendsSETTINGSframe which counts as confirmation that HTTP/2 is being used plus any flow control configuration we want our peer to honour: Client sendsMagicframe to confirm HTTP/2 is being used and thenSETTINGSwith its requirements for the connection. Yes,Magicframe is always the same. Still curious aboutMagicframe? Readhttps://tools.ietf.org/html/rfc7540#section-3.5. End-points are also supposed to ACK the receipt ofSETTINGSframefrom the other peer and the way they do it is by responding with another emptySETTINGSframewith ACK flag set: 4. Exchanging data Connection-wise we're all set now. For HTTP/2 GET/HEAD requests there is a specific frame type calledHEADERSwhich as the name implies carries HTTP/2 header information. If there was payload it would be carried insideDATAframe type but as this is just aHEADrequest then noDATAframe follows. 5. Appendix A - Other common frame types 5.1 WINDOW_UPDATE There are other common frame types and in my capturethe one that came up wasWINDOW_UPDATE. If you look at section 3 above we see that Client advised BIG-IP that its Initial Window Size was1073741824. WINDOW_UPDATEjust adjusted this value to1073676289: This is HTTP/2 flow control in action. 5.2 DATA in another test (http2-v2.zip) I usedHTTP/2 GETrequest instead ofHEADand requested more data which comes in throughDATAframe type: End Streamflag is false in allDATAmessages except for the last one. It signals when there is more data as well as the lastDATAframe. 5.3 GOAWAY In a subsequent test (http2-connection-idletimeout-1.zip)I set Connection Idle Timeoutin HTTP/2 profile to 1 to force BIG-IP sendingGOAWAYframe to close down connection after 1 second of idle connection. After last piece of data is sent by BIG-IP to client (frame #39), BIG-IP waits 1 second and sendsGOAWAYframewhich initiates the shutdown of HTTP/2 connection. GOAWAYmessages always containsPromised-Stream-IDwhich tells the client what is the lastStream IDit processed. A newStream IDis typically created for every new HTTP request (viaHEADERSmessage). We can see that a new HTTP request slipped in onframe #46but ignored as connection had already been closed on BIG-IP's side.7.1KViews3likes12Comments