metrics
16 Topics
ADC03: Incomplete Observability – A Critical Application Delivery Challenge
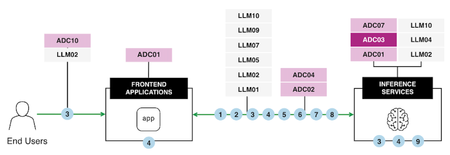
Observability is the backbone of modern application delivery, enabling the detection of performance issues, analyzing system usage, and monitoring overall health. However, Incomplete Observability, characterized by insufficient logging, inadequate monitoring tools, and inconsistent data collection, introduces significant business risks. These risks range from limited visibility into performance bottlenecks and prolonged service disruptions to flawed scaling decisions and inefficient operations. To address these challenges effectively, it is crucial to understand the core issues at hand and implement robust strategies and tools, such as F5 BIG-IP and OpenTelemetry, that enhance observability across the infrastructure. Let's explore the impacts of Incomplete Observability and practical solutions, incorporating lessons from a real-world use case. AI Reference Architecture In an AI-powered application ecosystem, observability plays a pivotal role in coordinating and monitoring interactions between end users, frontend applications, and inference services. The following AI Reference Architecture diagram illustrates a typical flow: Diagram Overview: End Users initiate requests through frontend applications. These applications connect with backend Large Language Models (LLMs) based on user-specific needs. Inference Services operate at the core, processing data to deliver accurate and efficient results. Monitoring critical pipelines ensures reliability and scalability while maintaining secure data flows. By aligning observability with such an architecture, AI systems can handle complex pipelines effectively, optimizing performance, security, and governance. Consequences of Incomplete Observability Impact on Performance The absence of complete observability limits an organization’s ability to proactively detect and resolve performance bottlenecks. Without detailed insights into key metrics like latency, response times, and resource utilization, it becomes nearly impossible to identify root causes or improve application responsiveness. For example, undetected spikes in CPU or memory usage can lead to degraded user experiences and even system crashes. Impact on Availability Incomplete observability hampers availability—an essential component of application delivery. Downtime and overlooked critical failures are costly, with 32% of organizations reporting an average outage cost exceeding $500,000 per hour (New Relic). For distributed systems, limited visibility can cause cascading failures, with a minor issue in one system component triggering widespread service interruptions before being detected. Impact on Scalability Dynamic and scalable infrastructure is essential for supporting modern applications with variable workloads. Incomplete observability creates significant obstacles in tracking traffic trends and resource utilization accurately, leading to resource under-provisioning or over-provisioning that wastes budgetary resources or results in outages. Impact on Operational Efficiency Operational inefficiencies arise when IT teams are forced to sift through fragmented, inconsistent data sets to identify issues. Logs spread across incompatible formats or disconnected tools lead to delays in troubleshooting and limited optimization opportunities. This reduces teams' ability to respond to incidents promptly and improve overall system performance. Best Practices for Overcoming Observability Gaps F5's BIG-IP and OpenTelemetry address these challenges by delivering end-to-end observability capabilities requiring real-time insights into application health, performance bottlenecks, and operational metrics. These tools facilitate timely root cause analysis and enable proactive management of distributed systems. Enhanced Observability Framework: Use Case Overview The following diagram illustrates a practical implementation of comprehensive observability using tools like F5 BIG-IP and OpenTelemetry: Use Case Breakdown Consolidate Traffic via F5 BIG-IP LT BIG-IP LTM acts as a centralized point for SSL termination, iRules, and high-speed logging, capturing critical metrics like latency, VIP health, and trace IDs. Traffic is centrally analyzed to provide real-time visibility into application flow dynamics. Capture and Export Logs & Metrics Key metrics, logs, traces, and request IDs are captured and exported for downstream analysis. Logs are standardized across systems, ensuring that valuable data isn't lost in noise. Standardize Observability with OpenTelemetry OpenTelemetry normalizes diverse observability patterns into a unified data model. This enables cross-system compatibility and real-time trend comparisons in distributed environments. Implement Dynamic Alerts & Automated Responses Configure dynamic alerting systems to notify teams when anomalies are detected and integrate automated responses for tasks such as scaling resources or rerouting traffic. Create Unified Dashboards & Analytics Observability platforms like ELK, Prometheus, and Datadog aggregate logs and metrics into a central dashboard, delivering actionable intelligence to IT teams. Establish Feedback Loops for Continuous Improvement Feedback loops using historical performance data enable ongoing improvements in application delivery processes. Insights refine operational decisions and better align infrastructure with real-time demand. Key Benefits Enhanced visibility into application flows, including API interactions, access patterns, and system utilization. Rapid issue detection and mitigation using real-time analytics and automated responses. Resource optimization ensures cost-effective scaling aligned with workload demands. Improved governance and security through dynamic control of inter-application communications. Conclusion Incomplete observability disrupts critical aspects of performance, availability, scalability, and operational efficiency. By leveraging solutions like F5 BIG-IP and OpenTelemetry, alongside enhanced observability frameworks, organizations can address visibility gaps effectively. Dynamic alerting systems, unified dashboards, and standardization tools enable real-time insights, fostering a culture of data-driven decisions and continuous service improvement. Observability is no longer just a supporting feature. It has become the strategic foundation for reliable, high-performing, and secure digital ecosystems. Start improving your observability practices today to achieve long-term success in application delivery. Reference Articles Enhancing BIG-IP with F5 Distributed Cloud: Automated Service Discovery for Scalable Application Delivery and Security Adopting SRE practices with F5: Observability and beyond with ELK Stack Monitor Application Availability with F5 BIG-IP LTM Why Application Observability and Insights Matter Gain insights into the performance of your F5 BIG-IP LTM and DNS solutions ADSP Platform overview The Application Delivery Top 10 AI reference architecture40Views1like0Comments
Does F5 AST natively support collecting and visualizing VS analytics metrics from AVR?
Hi everyone, I’d like to confirm whether F5 AST natively supports collecting and visualizing Virtual Server (VS) analytics metrics generated by the AVR module (for example, transactions per second, latency, throughput, etc.). If it doesn’t currently support AVR-based metrics out of the box, how complex would it be to add those metrics manually — for instance, by extending the telemetry configuration or customizing the data model in AST? Has anyone already tried integrating AVR data into AST dashboards? Thanks in advance!217Views0likes2CommentsF5 Distributed Cloud Telemetry (Metrics) - Prometheus
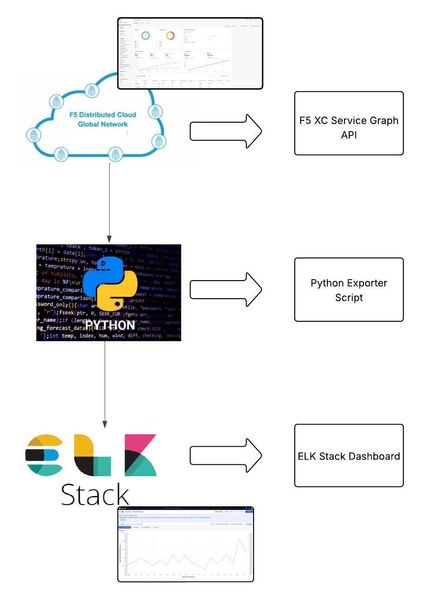
Scope This article walks through the process of collecting metrics from F5 Distributed Cloud’s (XC) Service Graph API and exposing them in a format that Prometheus can scrape. Prometheus then scrapes these metrics, which can be visualized in Grafana. Introduction Metrics are essential for gaining real-time insight into service performance and behaviour. F5 Distributed Cloud (XC) provides a Service Graph API that captures service-to-service communication data across your infrastructure. Prometheus, a leading open-source monitoring system, can scrape and store time-series metrics — and when paired with Grafana, offers powerful visualization capabilities. This article shows how to integrate a custom Python-based exporter that transforms Service Graph API data into Prometheus-compatible metrics. These metrics are then scraped by Prometheus and visualized in Grafana, all running in Docker for easy deployment. Prerequisites Access to F5 Distributed Cloud (XC) SaaS tenant VM with Python3 installed Running Prometheus instance (If not check "Configuring Prometheus" section below) Running Grafana instance (If not check "Configuring Grafana" section below) Note – In this demo, an AWS VM is used with Python installed and running exporter (port - 8888), Prometheus (host port - 9090) and Grafana (port - 3000) running as docker instance, all in same VM. Architecture Overview F5 XC API → Python Exporter → Prometheus → Grafana Building the Python Exporter To collect metrics from the F5 Distributed Cloud (XC) Service Graph API and expose them in a format Prometheus understands, we created a lightweight Python exporter using Flask. This exporter acts as a transformation layer — it fetches service graph data, parses it, and exposes it through a /metrics endpoint that Prometheus can scrape. Code Link -> exporter.py Key Functions of the Exporter Uses XC-Provided .p12 File for Authentication: To authenticate API requests to F5 Distributed Cloud (XC), the exporter uses a client certificate packaged in a .p12 file. This file must be manually downloaded from the F5 XC console (steps) and stored on the VM where the Python script runs. The script expects the full path to the .p12 file and its associated password to be specified in the configuration section. Fetches Service Graph Metrics: The script pulls service-level metrics such as request rates, error rates, throughput, and latency from the XC API. It supports both aggregated and individual load balancer views. Processes and Structures the Data: The exporter parses the raw API response to extract the latest metric values and converts them into Prometheus exposition format. Each metric is labelled (e.g., by vhost and direction) for flexibility in Grafana queries. Exposes a /metrics Endpoint: A Flask web server runs on port 8888, serving the /metrics endpoint. Prometheus periodically scrapes this endpoint to ingest the latest metrics. Handles Multiple Metric Types: Traffic metrics and health scores are handled and formatted individually. Each metric includes a descriptive name, type declaration, and optional labels for fine-grained monitoring and visualization. Running the Exporter python3 exporter.py > python.log 2>&1 & This command runs exporter.py using Python3 in background and redirects all standard output and error messages to python.log for easier debugging. Configuring Prometheus docker run -d --name=prometheus --network=host -v $(pwd)/prometheus.yml:/etc/prometheus/prometheus.yml prom/prometheus:latest Prometheus is running as docker instance in host network (port 9090) mode with below configuration (prometheus.yml), scrapping /metrics endpoint exposed from python flask exporter on port 8888 every 60 seconds. Configuring Grafana docker run -d --name=grafana -p 3000:3000 grafana/grafana:latest Private IP of the Prometheus docker instance along with port (9090) is used as data source in Grafana configuration. Once Prometheus is configured under Grafana Data sources, follow below steps: Navigate to Explore menu Select “Prometheus” in data source picker Choose appropriate metric, in this case “f5xc_downstream_http_request_rate” Select desired time range and click “Run query” Observe metrics graph will be displayed Note : Some requests need to be generated for metrics to be visible in Grafana. A broader, high-level view of all metrics can be accessed by navigating to “Drilldown” and selecting “Metrics”, providing a comprehensive snapshot across services. Conclusion F5 Distributed Cloud’s (F5 XC) Service Graph API provides deep visibility into service-to-service communication, and when paired with Prometheus and Grafana, it enables powerful, real-time monitoring without vendor lock-in. This integration highlights F5 XC’s alignment with open-source ecosystems, allowing users to build flexible and scalable observability pipelines. The custom Python exporter bridges the gap between the XC API and Prometheus, offering a lightweight and adaptable solution for transforming and exposing metrics. With Grafana dashboards on top, teams can gain instant insight into service health and performance. This open approach empowers operations teams to respond faster, optimize more effectively, and evolve their observability practices with confidence and control.1.5KViews3likes2CommentsF5 Distributed Cloud Telemetry (Metrics) - ELK Stack
As we are looking into exporting metrics data to the ELK stack using Python script, let's first get a high-level overview of the same. Metrics are numerical values that provide actionable insights into the performance, health and behavior of systems or applications over time, allowing teams to monitor and improve the reliability, stability and performance of modern distributed systems. ELK Stack (Elasticsearch, Logstash, and Kibana) is a powerful open-source platform. It enables organizations to collect, process, store, and visualize telemetry data such as logs, metrics, and traces from remote systems in real-time.291Views2likes0CommentsUnlocking Insights: Enhancing Observability in F5 NGINXaaS for Azure for Optimal Operations
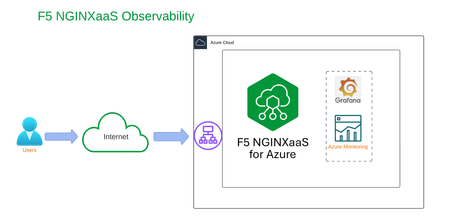
Introduction To understand application performance, you need more than just regular health checks. You need to look at the system’s behavior, how users use it, and find possible slowdowns before they become big problems. By using F5 NGINXaaS for Azure, organizations can gain enhanced visibility into their backend applications through extensive metrics, API (access) logs, and operational logs within Azure environments. This proactive approach helps prevent minor issues from developing into major challenges while optimizing resource efficiency. This technical guide highlights advanced observability techniques and demonstrates how organizations can leverage F5 NGINXaaS to create robust, high-performing application delivery solutions that ensure seamless and responsive user experiences. Benefits of F5 NGINX as a Service F5 NGINXaaS for Azure provides robust integration with ecosystem tools designed to monitor and analyze application health and performance. It uses rich telemetry from granular metrics across various protocols, including HTTP, TLS, TCP, and UDP. For technical experts overseeing deployments in Azure, this service delivers valuable insights that facilitate more effective troubleshooting and optimize workflows for streamlined operations. Key advantages of F5 NGINXaaS include access to over 200 detailed health and performance metrics that are critical for ensuring application stability, scalability, and efficiency. Please refer to the documentation for detailed information to learn more about the available metrics. There are two ways to monitor metrics in F5 NGINXaaS for Azure, providing flexibility in how you can track the health and performance of your applications: Azure Monitoring Integration for F5 NGINXaaS: An Azure-native solution delivering detailed analytical reports and customizable alerts. Grafana Dashboard Support: A visualization tool specifically designed to provide real-time, actionable insights into system health and performance. Dive Deep with Azure Monitoring for F5 NGINXaaS Azure Monitoring integration with F5 NGINXaaS provides a comprehensive observability solution tailored to dynamic cloud environments, equipping teams with the tools to enhance application performance and reliability. A crucial aspect of this solution is the integration of F5 NGINXaaS access and error logs, which offers insights essential for troubleshooting and resolving issues effectively. By combining these logs with deep insights into application and performance metrics such as request throughput, latency, error rates, and resource utilization, technical teams can make informed decisions to optimize their applications. Key Features Include: Advanced Analytics: Explore detailed traffic patterns and usage trends to better understand application load dynamics. This allows teams to fine-tune configurations and improve performance based on actual user activity. Customizable Alerts: Set specific thresholds for key performance indicators to receive immediate notifications about anomalies, such as unexpected spikes in 5xx error rates or latency challenges. This proactive approach empowers teams to resolve incidents swiftly and minimize their impact. Detailed Metrics: Utilize comprehensive metrics encompassing connection counts, active connections, and request processing times. These insights facilitate better resource allocation and more efficient traffic management. Logs Integration: Access and analyze F5 NGINXaaS logs alongside performance metrics, providing a holistic view of application behavior. This integration is vital for troubleshooting, enabling teams to correlate log data with observability insights for effective issue identification and resolution. Scalability Insights: Monitor real-time resource allocation and consumption. Predict growth challenges and optimize scaling decisions to ensure your F5 NGINXaaS service deployments can handle variable client load effectively. By integrating Azure Monitoring with F5 NGINXaaS, organizations can significantly enhance their resilience, swiftly tackle performance challenges, and ensure that their services consistently deliver outstanding user experiences. With actionable data at their fingertips, teams are well-positioned to achieve operational excellence and foster greater user satisfaction. Visualize Success with Native Azure Grafana Dashboard Enable the Grafana dashboard and import the F5 NGINXaaS metrics dashboard to take your monitoring capabilities to the next level. This dynamic integration provides a clear view of various performance metrics, allowing teams to make informed decisions backed by insightful data. Together, Azure Monitoring and the Grafana Dashboard form a strong alliance, creating a comprehensive observability solution that amplifies your application’s overall performance and reliability. The Grafana interface allows real-time querying of performance metrics, offering intuitive visual tools like graphs and charts that simplify complex data interpretation. With Azure Monitoring, Grafana builds a robust observability stack, ensuring proactive oversight and reactive diagnostics. Getting Started with NGINXaaS Azure Workshop We have curated self-paced workshops designed to help you effectively leverage the enhanced observability features of F5 NGINXaaS. These workshops provide valuable insights and hands-on experience, empowering you to develop robust observability in a self-directed learning environment. Azure monitoring lab workshop will enhance your skills in creating and analyzing access logs with NGINX. You’ll learn to develop a comprehensive log format, capturing essential details from backend servers. By the end, you'll be equipped to use Azure’s monitoring tools effectively, significantly contributing to your growth and success. In the Native Azure Grafana Dashboard workshop, you'll explore the integration of F5 NGINXaaS for Azure with Grafana for effective service monitoring. You'll create a dashboard to track essential metrics for your backend servers. This hands-on session will equip you with the skills to analyze real-time data and make informed decisions backed by valuable insights. Upon completing this lab exercise, you will have gained practical expertise in leveraging enhanced observability features of F5 NGINXaaS. You will be proficient in creating and analyzing access logs, ensuring you can effectively capture critical data from backend servers. Additionally, you will have developed the skills necessary to integrate F5 NGINXaaS with Grafana, allowing you to build a dynamic dashboard that tracks essential metrics in real-time. This hands-on experience will empower you to make informed decisions based on valuable insights, significantly enhancing your capabilities in monitoring and maintaining your applications. Conclusion By fully utilizing the observability features of F5 NGINXaaS, the organization can gain valuable insights that enhance performance and efficiency. With Azure Monitoring and Grafana working together, teams can manage proactively and make informed, data-driven decisions. This approach leads to smoother web experiences and improves operational performance. Interested in getting started with F5 NGINXaaS for Azure? You can find us on the Azure marketplace.835Views1like0CommentssysHttpStatRespBucket1k SNMP metrics meaning
Hi, I would like to get information about few of the exposed SNMP metrics which description is very unclear... sysHttpStatRespBucket1k with oid 1.3.6.1.4.1.3375.2.1.1.2.4.17 sysHttpStatRespBucket4k with oid 1.3.6.1.4.1.3375.2.1.1.2.4.18 If we take sysHttpStatRespBucket1k, I found following description "The number of responses under 1k." but are we talking of a HTTP response size or a duration? Thanks for light anyone could provide on this topic.Solved144Views0likes1Comment
OIDs for virtuals servers stats
hi everybody, I want gets some stats by SNMP like the stats display on LTM BIG-IP GUI (Statistics ›› Module Statistics : Local Traffic >> Statistics Type = virtual servers) What is the OIDs for each stats virtual server name virtual server ip virtual server bits (in/out), packets (in/out) virtual server current connection thanks a lot1.2KViews0likes1CommentF5 Monitoring
Hi, I put together technologies and prepare a full fledge monitoring system for F5 Device overall and LTM module. Can be extend with other modules such as asm, gtm etc. There is a link for presentation regarding all details. Please check if interested can contact with me for details. Here Presentation. Compare tmm cpu cycles with vserver and irules Interface / Vlan PPS/BWD values corelation with vservers showing top usage on what. Showing http compression values as active bandwidth corelation with compression Irule cpu cycle checks and corelate which i rule uses most and what effects after changing irule to operate differently. Saving / Usage on Irules. Note: Much more use cases like this can be added based upon needs. Thanks464Views0likes3CommentsGTM: avoiding flapping DNS answers with RTT method
I am in the need to understand how GTM metrics work for GTM LDNS probes. 1) how they can be logged the decision? I am using 11.2 but moving fast to 11.4.1.. :) 2) Lets make an example. if our GTM chooses a VIP in USA for 100 consecutive times because the RTT is lower going to this USA VIP and then for 1 time it gets a better value - for whatever reason - to go to another VIP, for example to Australia, will it be considered valid the last value which differs from the original 100 previous time? is there cache variation value that can be configured to avoid this flapping choices? (We had this choice in Cisco GSS). 3) how long is the non-optimizes Australian value kept in cache until a new value is reconsidered? It is the Inactive timeout of 28 days?Solved1.1KViews0likes8Comments
Architecting Scalable Infrastructures: CPS versus DPS
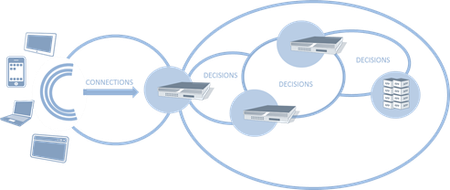
#webperf As we continue to find new ways to make connections more efficient, capacity planning must look to other metrics to ensure scalability without compromising performance. Infrastructure metrics have always been focused on speeds and feeds. Throughput, packets per second, connections per second, etc… These metrics have been used to evaluate and compare network infrastructure for years, ultimately being used as a critical component in data center design. This makes sense. After all, it's not rocket science to figure out that a firewall capable of handling 10,000 connections per second (CPS) will overwhelm a next hop (load balancer, A/V scanner, etc… ) device only capable of 5,000 CPS. Or will it? The problem with old skool performance metrics is they focus on ingress, not egress capacity. With SDN pushing a new focus on both northbound and southbound capabilities, it makes sense to revisit the metrics upon which we evaluate infrastructure and design data centers. CONNECTIONS versus DECISIONS As we've progressed from focusing on packets to sessions, from IP addresses to users, from servers to applications, we've necessarily seen an evolution in the intelligence of network components. It's not just application delivery that's gotten smarter, it's everything. Security, access control, bandwidth management, even routing (think NAC), has become much more intelligent. But that intelligence comes at a price: processing. That processing turns into latency as each device takes a certain amount of time to inspect, evaluate and ultimate decide what to do with the data. And therein lies the key to our conundrum: it makes a decision. That decision might be routing based or security based or even logging based. What the decision is is not as important as the fact that it must be made. SDN necessarily brings this key differentiator between legacy and next-generation infrastructure to the fore, as it's just software-defined but software-deciding networking. When a switch doesn't know what to do with a packet in SDN it asks the controller, which evaluates and makes a decision. The capacity of SDN – and of any modern infrastructure – is at least partially determined by how fast it can make decisions. Examples of decisions: URI-based routing (load balancers, application delivery controllers) Virus-scanning SPAM scanning Traffic anomaly scanning (IPS/IDS) SQLi / XSS inspection (web application firewalls) SYN flood protection (firewalls) BYOD policy enforcement (access control systems) Content scrubbing (web application firewalls) The DPS capacity of a system is not the same as its connection capacity, which is merely the measure of how many new connections a second can be established (and in many cases how many connections can be simultaneously sustained). Such a measure is merely determining how optimized the networking stack of any given solution might be, as connections – whether TCP or UDP or SMTP – are protocol oriented and it is the networking stack that determines how well connections are managed. The CPS rate of any given device tells us nothing about how well it will actually perform its appointed tasks. That's what the Decisions Per Second (DPS) metric tells us. CONSIDERING BOTH CPS and DPS Reality is that most systems will have a higher CPS compared to its DPS. That's not necessarily bad, as evaluating data as it flows through a device requires processing, and processing necessarily takes time. Using both CPS and DPS merely recognizes this truth and forces it to the fore, where it can be used to better design the network. A combined metric helps design the network by offering insight into the real capacity of a given device, rather than a marketing capacity. When we look only at CPS, for example, we might feel perfectly comfortable with a topological design with a flow of similar CPS capacities. But what we really want is to make sure that DPS –> CPS (and vice-versa) capabilities were matched up correctly, lest we introduce more latency than is necessary into a given flow. What we don't want is to end up with is a device with a high DPS rate feeding into a device with a lower CPS rate. We also don't want to design a flow in which DPS rates successively decline. Doing so means we're adding more and more latency into the equation. The DPS rate is a much better indicator of capacity than CPS for designing high-performance networks because it is a realistic measure of performance, and yet a high DPS coupled with a low CPS would be disastrous. Luckily, it is almost always the case that a mismatch in CPS and DPS will favor CPS, with DPS being the lower of the two metrics in almost all cases. What we want to see is as close a CPS:DPS ratio as possible. The ideal is 1:1, of course, but given the nature of inspecting data it is unrealistic to expect such a tight ratio. Still, if the ratio becomes too high, it indicates a potential bottleneck in the network that must be addressed. For example, assume an extreme case of a CPS:DPS of 2:1. The device can establish 10,000 CPS, but only process at a rate of 5,000 DPS, leading to increasing latency or other undesirable performance issues as connections queue up waiting to be processed. Obviously there's more at play than just new CPS and DPS (concurrent connection capability is also a factor) but the new CPS and DPS relationship is a good general indicator of potential issues. Knowing the DPS of a device enables architects to properly scale out the infrastructure to remediate potential bottlenecks. This is particularly true when TCP multiplexing is in play, because it necessarily reduces CPS to the target systems but in no way impacts the DPS. On the ingress, too, are emerging protocols like SPDY that make more efficient use of TCP connections, making CPS an unreliable measure of capacity, especially if DPS is significantly lower than the CPS rating of the system. Relying upon CPS alone – particularly when using TCP connection management technologies - as a means to achieve scalability can negatively impact performance. Testing systems to understand their DPS rate is paramount to designing a scalable infrastructure with consistent performance. The Need for (HTML5) Speed SPDY versus HTML5 WebSockets Y U No Support SPDY Yet? Curing the Cloud Performance Arrhythmia F5 Friday: Performance, Throughput and DPS Data Center Feng Shui: Architecting for Predictable Performance On Cloud, Integration and Performance1.1KViews0likes0Comments