irules
20649 Topics
irule to insert http header with values based on received radius accounting avp
I have a requirement to insert msisdn gotten from radius logs into https virtual server (http irule). It is pretty similar to this. insert HTTP header according to a value received in Radius accounting | DevCentral " Radius accounting arrives with following attributes: Acct-Status-Type=1 Calling-Station-Id=123456789 Framed-IP-Address=1.1.1.1 An entry is inserted to a table 1.1.1.1 (key) -> 123456789 (value) HTTP request arrives from source IP 1.1.1.1 The F5 will insert a header "MSISDN: 123456789" to the HTTP request before forwarding. Radius accounting arrives with following attributes: Acct-Status-Type=2 Calling-Station-Id=123456789 Framed-IP-Address=1.1.1.1 The value is removed 1.1.1.1 (key) -> (empty) HTTP request arrives from source IP 1.1.1.1 The F5 will not insert a header (not "MSISDN: 123456789" and not "MSISDN: ") " I have created two virtual servers. one , a radius accounting virtual server (with no pool members) on port 1813. it uses this irule. when CLIENT_DATA { set avp40 [RADIUS::avp 40 integer] set client_ip [RADIUS::avp 8 ip4] set msisdn [RADIUS::avp 31 string] if { $avp40 == 1 || $avp40 == 3 } { # Start or Interim-Update → refresh TTL table set -subtable "ip2msisdn" $client_ip $msisdn 540 } elseif { $avp40 == 2 } { table delete -subtable "ip2msisdn" $client_ip } } The HTTPs virtual server with ssl termination, has following irule. when HTTP_REQUEST { set client_ip [IP::client_addr] set msisdn [table lookup -subtable "ip2msisdn" $client_ip] if { $msisdn ne "" } { HTTP::header insert "X-MSISDN" $msisdn HTTP::header insert "X-Auth-Status" "AUTHORIZED" } else { HTTP::header insert "X-Auth-Status" "UNKNOWN" HTTP::header insert "X-MSISDN" "NOT_FOUND" } } we see several logs when logs are added on radius irule. Yet, we never get to see ip-msisdn match, when user browser attempts to access the website. We can confirm radius feeds are being sent by GGSN. example. Aug 20 13:14:02 slot1/OAU info tmm6[19301]: Rule /Common/awo <CLIENT_DATA>: RADIUS START: 10.63.27.96 -> 2347038201355 Aug 20 13:14:02 slot1/OAU info tmm16[19302]: Rule /Common/awo <CLIENT_DATA>: RADIUS STOP: removed 10.36.203.125 Aug 20 13:14:02 slot1/OAU info tmm6[19301]: Rule /Common/awo <CLIENT_DATA>: RADIUS STOP: removed 10.36.203.125 Aug 20 13:14:02 slot1/OAU info tmm16[19302]: Rule /Common/awo <CLIENT_DATA>: RADIUS START: 10.63.27.62 -> 2347069332877 Aug 20 13:14:02 slot1/OAU info tmm8[19301]: Rule /Common/awo <CLIENT_DATA>: RADIUS START: 10.63.27.62 -> 2347069332877 Aug 20 13:14:02 slot1/OAU info tmm17[19302]: Rule /Common/awo <CLIENT_DATA>: RADIUS STOP: removed 10.29.44.232 Aug 20 13:14:02 slot1/OAU info tmm17[19302]: Rule /Common/awo <CLIENT_DATA>: RADIUS STOP: removed 10.38.116.115 Aug 20 13:14:02 slot1/OAU info tmm17[19302]: Rule /Common/awo <CLIENT_DATA>: RADIUS START: 10.63.15.231 -> 2347070645170 Aug 20 13:14:02 slot1/OAU info tmm17[19302]: Rule /Common/awo <CLIENT_DATA>: RADIUS STOP: removed 10.29.44.232 Aug 20 13:14:02 slot1/OAU info tmm17[19302]: Rule /Common/awo <CLIENT_DATA>: RADIUS STOP: removed 10.38.116.115 Aug 20 13:14:02 slot1/OAU info tmm17[19302]: Rule /Common/awo <CLIENT_DATA>: RADIUS START: 10.63.15.231 -> 2347070645170 Aug 20 13:14:02 slot1/OAU info tmm6[19301]: Rule /Common/awo <CLIENT_DATA>: RADIUS START: 10.63.15.190 -> 2348137835053 Aug 20 13:14:02 slot1/OAU info tmm[19301]: Rule /Common/awo <CLIENT_DATA>: RADIUS START: 10.63.15.224 -> 2348140105877 . How do we force write the radius logs to memory on F5. The F5 is a VIPRION.45Views0likes1Comment
insert HTTP header according to a value received in Radius accounting
Hi, I'd like to know if the following is somehow achievable: I want that from Every Radius Accounting message (UDP 1813) the BIGIP will look for 3 attributes: Calling-Station-Id, Framed-IP-Address & Acct-Status-Type In case the Radius attribute Acct-Status-Type=1 (Start) the BIGIP will insert an entry to a table in which the key will be the Framed-IP-Address and the value will be the Calling-Station-Id. In case the Radius attribute Acct-Status-Type=2 (Stop) the BIGIP will remove the value of an entry in the same table (remove the value which is the calling-station-id assigned to the framed-ip-address) Then when HTTP transaction arrive from a client IP which appears as a key in the table, the BIGIP will insert the value assigned to that key in the table (i.e. the corresponding Calling-Station-Id) to an HTTP header called "MSISDN". Example: Radius accounting arrives with following attributes: Acct-Status-Type=1 Calling-Station-Id=123456789 Framed-IP-Address=1.1.1.1 An entry is inserted to a table 1.1.1.1 (key) -> 123456789 (value) HTTP request arrives from source IP 1.1.1.1 The F5 will insert a header "MSISDN: 123456789" to the HTTP request before forwarding. Radius accounting arrives with following attributes: Acct-Status-Type=2 Calling-Station-Id=123456789 Framed-IP-Address=1.1.1.1 The value is removed 1.1.1.1 (key) -> (empty) HTTP request arrives from source IP 1.1.1.1 The F5 will not insert a header (not "MSISDN: 123456789" and not "MSISDN: ") Hope it's clear. Thanks in advance, Yaniv847Views0likes11Comments
An Irule for Client Ssl Profile that Allows Unassigned TLS Extension Values (17516)
Hello Community, I have a requirement to allow enriched https header enrichment. The SSL negotiation (I'm doing ssl termination on F5) fails because the enriched header from client contains reserved tls extension values. (https://www.iana.org/assignments/tls-extensiontype-values/tls-extensiontype-values.xhtmltls-extensiontype-values-1). The Client Hello request in the SSL Handshake was captured and contained an Extensions list, which included a reserved TLS Extension value (17156), which the F5 isn't presenting in Server Hello. I need an irule that can allow that Extension to be added on the client ssl profile so the ssl handshake doesn't fail.3.5KViews0likes28Comments
Weblogic JSessionID Persistence
Problem this snippet solves: Contributed by: unRuleY, Summarized by: deb Note: The previous version of this iRule contained escaped newlines following the session command, which in versions 10.0 - 10.2.0 causes TMM to core as documented in CR135937 / SOL11427. This was fixed in 10.2.1. See this related Codeshare example for details on how to take advantage of session replication on the WebLogic servers with targeted node failover in an iRule. Provides persistence on the jsessionid value found in either the URI or a cookie. When a request is received, the iRule first looks for a "jsessionid" cookie, and if not found, for a "jsessionid" parameter in the requested URI. If either is found, a persistence record is created if it doesn't already exist, or followed if it does. If neither is found, the request is load balanced according to the load balancing method applied to the virtual server and persisted based on the client's IP address. In order to ensure the second and subsequent requests follow the first, LTM must create a persistence record indicating the pool member to which the first request was load balanced. If the server is setting the jsessionid in a cookie, the persistence key value may be extracted from the server response to create the persistence record. If the server is setting the jsessionid in the URLs, source address persistence with a short timeout is recommended to track the original destination until the jsessionid is sent. How to use this snippet: To ensure a new persistence record is followed when a request is re-load balanced in a client-side Keep-Alive connection, apply a OneConnect profile to the virtual server. The iRule assumes the jsessionid is in upper case when used as a cookie name. If this isn't the case, please update the example. To persist on jsessionid, create the iRule below and create a custom Universal persistence profile, with Match Across Services enabled, that uses the iRule. Then use this custom Universal persistence profile as the Default Persistence profile on your Virtual Server. Applying a Fallback Persistence profile of type Source Address Affinity with a host mask and a short timeout (the default source_addr persistence profile will do the trick) to your Virtual Server is also recommended. Attention, if you are running firmware 11.0 - 11.2.1 and enabled "Match Across Services"! There is a bug inside. SOL14061 This iRule requires LTM v10. or higher. Code : when HTTP_REQUEST { # Log details for the request set log_prefix "[IP::client_addr]:[TCP::client_port]" log local0. "$log_prefix: Request to [HTTP::uri] with cookie: [HTTP::cookie value JSESSIONID]" # Check if there is a JSESSIONID cookie if { [HTTP::cookie "JSESSIONID"] ne "" }{ # Persist off of the cookie value with a timeout of 1 hour (3600 seconds) persist uie [string tolower [HTTP::cookie "JSESSIONID"]] 3600 # Log that we're using the cookie value for persistence and the persistence key if it exists. log local0. "$log_prefix: Used persistence record from cookie. Existing key? [persist lookup uie [string tolower [HTTP::cookie "JSESSIONID"]]]" } else { # Parse the jsessionid from the path. The jsessionid, when included in the URI, is in the path, # not the query string: /path/to/file.ext;jsessionid=1234?param=value set jsess [findstr [string tolower [HTTP::path]] "jsessionid=" 11] # Use the jsessionid from the path for persisting with a timeout of 1 hour (3600 seconds) if { $jsess != "" } { persist uie $jsess 3600 # Log that we're using the path jessionid for persistence and the persistence key if it exists. log local0. "$log_prefix: Used persistence record from path: [persist lookup uie $jsess]" } } } when HTTP_RESPONSE { # Check if there is a jsessionid cookie in the response if { [HTTP::cookie "JSESSIONID"] ne "" }{ # Persist off of the cookie value with a timeout of 1 hour (3600 seconds) persist add uie [string tolower [HTTP::cookie "JSESSIONID"]] 3600 log local0. "$log_prefix: Added persistence record from cookie: [persist lookup uie [string tolower [HTTP::cookie "JSESSIONID"]]]" } }6.3KViews2likes9CommentsF5 BIG-IP Multi-Site Dashboard
Code is community submitted, community supported, and recognized as ‘Use At Your Own Risk’. A comprehensive real-time monitoring dashboard for F5 BIG-IP Application Delivery Controllers featuring multi-site support, DNS hostname resolution, member state tracking, and advanced filtering capabilities. A 170KB modular JavaScript application runs entirely in your browser, served directly from the F5's high-speed operational dataplane. One or more sites operate as Dashboard Front-Ends serving the dashboard interface (HTML, JavaScript, CSS) via iFiles, while other sites operate as API Hosts providing pool data through optimized JSON-based dashboard API calls. This provides unified visibility across multiple sites from a single interface without requiring even a read-only account on any of the BIG-IPs, allowing you to switch between locations and see consistent pool, member, and health status data with almost no latency and very little overhead. Think of it as an extension of the F5 GUI: near real-time state tracking, DNS hostname resolution (if configured), advanced search/filtering, and the ability to see exactly what changed and when. It gives application teams and operations teams direct visibility into application pool state without needing to wait for answers from F5 engineers, eliminating the organizational bottleneck that slows down troubleshooting when every minute counts. https://github.com/hauptem/F5-Multisite-Dashboard576Views4likes2CommentsFingerprinting TLS Clients with JA4 on F5 BIG-IP
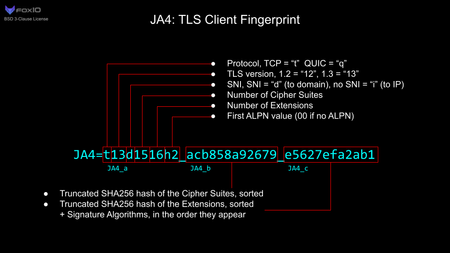
JA4+ is a set of simple network fingerprints that are both human and machine readable to facilitate more effective threat-hunting and analysis. In this article you will learn how you can use F5 iRules to gerenate JA4 TLS fingerprints.7.1KViews11likes1Commentlog local0. is not a debugging strategy!
But let's be honest...with iRules, it's pretty much all we've had. If you have ever debugged an iRule, you know the ritual. Former F5er Jibin_Han in an article once called the log command is "the crudest of debug facilities." He was not wrong. It is the printf of application delivery, and at high traffic the logging pipeline will happily truncate your output just to keep things spicy. So back in TMOS 13.1, he shipped something much better: ltm rule-profiler. It is a passive tracer baked right into TMM. (Did you know this? Most don't, including most F5ers I talk to!) You do not touch your script. You tell it which virtual server, events, and occurrences to watch, you flip it on, and it emits a timestamped execution trace of everything your iRule did. Events firing, rules matching, the Tcl VM grinding through bytecode, native commands getting dispatched, variables changing. The whole shebang. There is just one catch. Ok actually two. It is tmsh-only. No GUI, no REST endpoint, no nothing. You configure it by hand and you start and stop it by hand. The not so fun part, the output looks like this: 1780079189187194,RP_EVENT_ENTRY,/Common/testvip-http,CLIENT_ACCEPTED,22623,0x70373707000576,10.1.10.6,36086,0,10.1.10.50,80,0 1780079189187210,RP_RULE_ENTRY,/Common/testvip-http,/Common/myrule,22623,0x70373707000576,... 1780079189187225,RP_RULE_VM_ENTRY,... 1780079189187240,RP_CMD_BYTECODE,/Common/testvip-http,push1,... Now multiply that by a few hundred lines, sprinkle in microsecond timestamps you are expected to subtract in your head, and remember that every single custom iRules command is actually a round trip out of the Tcl VM and back into TMM. A command, inside a VM, inside the microkernel. We need to go deeper. Reading it raw is less "performance analysis" and more "staring at the green rain in The Matrix and pretending you can see the woman in the red dress." The data is genuinely great. It's just wearing a CSV trench coat and refusing to make eye contact. But that ends now. Let's talk about Rültracer. What Rültracer is Rültracer is an iApps LX extension that gives ltm rule-profiler the face it always deserved. When Jibin_Han released his 3-part article series (linked at the bottom of this article) introducing the rule-profiler, we had a couple interns who built an analysis engine called Campfire that used a perl-based flamegraph package to display the trace in context of the "lift" of each occurence within a trace. The challenge was you had to manually configure everything on BIG-IP, send the logs somewhere, collect those logs, then import them into where you built campfire to run. A lot of manual work to get to the good. But Rültracer? It runs on the BIG-IP. An on-box Node worker handles the unglamorous parts: it configures the profiler, sets up (and tears down) the log publisher, captures the trace stream into a per-session file, and serves that file to a browser app. The browser does all the parsing and visualization client side, so the box just ships raw CSV and gets out of the way. What you get: A sequence diagram and step-through debugger. The trace becomes a UML-style sequence diagram across six lifelines (Users, Event, Rule, Rule VM, Command VM, Command), with the TMM and Tcl VM sides color coded so you can actually see every handoff between the microkernel and the interpreter. Which matters, because that back-and-forth is exactly where iRule inefficiency likes to hide. Next to it sits a linked step-through with a timeline scrubber, variable state, and command replay. Click the diagram, the table follows. Click the table, the diagram follows. There's a Tclsh disassembler you can enable as well, and as long as you're willing to modify the parts of the iRules code under test. I wrote an article years ago on this disassembly functionality, it's worth the read to see what this functionality affords you. iRule source mapping. It pulls your actual iRule source and lights it up: which commands fired (with microseconds and counts), which branches never ran, and which lines were ambiguous multi-matches. Your code, annotated by what the trace really did. (this part is early stages, it needs work.) Flamegraphs, with diff. An interactive flamegraph where width equals inclusive time, so the widest frame is your prime suspect. Find the slow command without playing Where's Waldo. Captured a "before" and an "after"? The diff view paints frames red and blue by how their self-time shifted, so you can prove your optimization actually optimized. Cycles versus CPU. Rültracer takes the box's own ltm rule stats hardware cycle counters and turns them into honest performance tables: cycles to microseconds, percent of a CPU per request, and max requests per second before your iRule becomes the bottleneck. It even reconciles the authoritative cycle counts against the trace-derived numbers, and the gap between them is the profiler's own overhead. These are numbers you can bring to a capacity-planning meeting without getting laughed out of the room. This is based on Deb Allen's yesteryear work in excel for computing capacity with iRules and my update in doing this with python much later. Reports and exports. Export a capture as self-contained HTML, JSON, a Mermaid sequence diagram, or Brendan Gregg folded stacks. Share it, attach it to a ticket, or feed it to your own tooling. Multi-TMM aware. Captures that span multiple TMMs get partitioned by context id with a scope selector, because of course your traffic did not politely land on a single TMM. No (post RPM install) build steps, no cloud, no telemetry, no agent. Vanilla JS in the browser, a small ES5 worker on the box, fully self-contained. And it is a lab tool on purpose: tracing adds significant TMM overhead, so this is not something you run in production. Rültracer tears the profiler and publisher down for you on teardown, so you never accidentally leave the tap open. Installing it Rültracer installs over SSH. You build the RPM on your workstation, copy it to the BIG-IP, and run the installer on the box as root. The installer provisions the persistent data directory, installs the package through the iApps LX framework, runs the post-install step, and confirms the workers came up. Replace and with your BIG-IP's SSH host and port. If it answers on plain old port 22, drop the -P / -p flags. First time on a fresh box The installer script lives outside the RPM, so it rides along once: Copy the installer on the box (one time only) scp -O -P <port> build/install-onbox.sh root@<host>:/shared/images/ Build, ship, and install ./build/build-rpm.sh 0.7.1 0001 scp -O -P <port> build/dist/rultracer-0.7.1-0001.noarch.rpm root@<host>:/shared/images/ ssh -p <port> root@<host> /shared/images/install-onbox.sh 0.7.1-0001 Because the installer runs as root, it creates the session data directory owned by the restnoded worker user before the workers start (the worker is uid 198 and cannot create directories under /shared/ on its own). When it finishes, it prints your UI URL: https://BIG-IP-host/mgmt/shared/rultracer/ui/ Open that, and you are in. Follow-on updates The installer is already on the box, so the next rounds are just bump, build, ship, install like above. That is an in-place upgrade and it keeps your saved sessions. If you ever want a clean slate, pass --reinstall, but note it wipes session data, so hit the Sessions tab's "Download backup" button first if you care about what is in there. See it in action (The walkthrough covers a live capture end to end: pointing the profiler at a virtual server, driving a little traffic, then digging through the sequence diagram, flamegraph, and cycle stats on a real trace.) Conclusion This was a fun project to bring together something I've played with a lot since the v13.1 release but could never quite figure out a packaging solution to make it functional enough to rely on. You can find the code in the Rültracer repo on Github. Let me know in the comments if you take a look at this and submit any bugs ore feature requests as an issue out on Github. 299Views2likes0Comments
APM SAML IdP - SP Issuer Extraction
Problem this snippet solves: APM doesn't expose any detail about the SAML SP Issuer when authentication requests hitting APM as an IdP during an SP initiated SAMLRequest. This iRule when applied to a SAML IdP enabled virtual server will extract the assertion request, decode it and present the SAML SP Issuer ID as the session variable %{session.saml.request.issuer} within APM. How to use this snippet: This comes in real handy when performing authorisation of the resource and could help avoid having APM perform a TCP connection reset when a SAML resource isn't authorised. Code : when CLIENT_ACCEPTED { ACCESS::restrict_irule_events disable } when HTTP_REQUEST { if { [HTTP::path] equals "/saml/idp/profile/redirectorpost/sso" } { if { [HTTP::method] equals "POST" } { # Colelct POST data set content_length [HTTP::header value Content-Length] HTTP::collect $content_length } elseif { [HTTP::method] equals "GET" } { #TODO } } } when HTTP_REQUEST_DATA { set payload_data [URI::decode [HTTP::payload]] log local0. "payload=[URI::query "?$payload_data" "SAMLRequest"]" if { $payload_data contains "SAMLRequest" } { # Extract SAML request data set SAMLdata [b64decode [URI::query "?$payload_data" "SAMLRequest"]] set SAML_Issuer_loc [string first "saml:issuer" [string tolower $SAMLdata]] set SAML_Issuer_start [expr {[string first ">" $SAMLdata $SAML_Issuer_loc] + 1}] set SAML_Issuer_end [expr {[string first "<" $SAMLdata $SAML_Issuer_start] - 1}] set SAML_Issuer [string range $SAMLdata $SAML_Issuer_start $SAML_Issuer_end] if { !([ACCESS::session sid] equals "" ) } { ACCESS::session data set session.saml.request.issuer $SAML_Issuer } } } when ACCESS_SESSION_STARTED { if { [info exists SAML_Issuer] } { ACCESS::session data set session.saml.request.issuer $SAML_Issuer } } Tested this on version: 11.61.8KViews2likes8CommentsAppWorld LATAM 2026 - "Write Your First iRule" Contest
Este anuncio ha sido actualizado para incluir una traducción al español. Puede encontrar las instrucciones en español al final de la publicación. The iRules from Las Vegas and Berlin showcased incredible expertise. For this third iRules Contest, we're shifting focus to encouragement and education for the theme: "Write Your First iRule" Community Contest. We're challenging DevCentral community members attending AppWorld LATAM 2026 to design and build an iRule in a welcoming environment. Whether you are a first time iRules writer, or finding your footing, we can't wait to see what you create. (And don’t worry, it doesn't have to be your literal first iRule ever. It's the spirit of trying something new that counts.) The Challenge Plan out and write an iRule that tackles a use-case for BIG-IP's capabilities. You can: Create a new iRule Reimagine existing codeshare iRules from DevCentral Adapt a 20-lines-or-less iRule from the GitHub iRules Toolbox We value your fresh perspective and newer eyes. As this is a learning opportunity, we also encourage having fun with it. Prizes The submissions will be judged for category awards. All participants receive an exclusive contest t-shirt. Place Prize Category Awards $200/each Technical Excellence Award $500 Participation t-shirt What Makes for a Winning Entry? The 100-point scale judging criteria for submissions is defined below across four categories: Technical Excellence (25 points) Is it well-built and production ready? Consider Works correctly Performance-conscious (efficient, minimal resource impact) Follows security best practices Clean, readable code User Impact (25 points) Would you and other users actually use this? Consider: Solves a real operational problem or technical need need Practical applicability and potential adoption Clear business value Thorough documentation Innovation & Creativity (25 points) Does this solution show original thinking? Consider: Fresh perspective on common challenges Unique approach solving a modern problem Does it inspire collaboration and progress? Theme & Alignment (25 points) Does this iRule reflect your learnings from AppWorld LATAM 2026 and community resources? Consider: Applying the knowledge and skills you've learned Approachable to other new iRules writers Shows your effort to try something new to you Important Dates Contest Opens: June 8th, 2026 at 12:00am Pacific Time Submission Deadline: July 31st, 2026 at 11:59pm Pacific Time Winners Announced: August 14th, 2026 How to Enter The contest is open to all F5 partners, customers, and DevCentral members registered for and in attendance at the contest at AppWorld LATAM 2026, except as described in the Official Rules. Please see the Official Rules for complete terms, including conditions for participation and eligibility. Sign up for DevCentral and join the Community Contests group. Find Hannah or Buu at the Community area if you need any assistance. Build and submit before 11:59pm Pacific Time JULY 31, 2026. Edit your draft entry as much as you like, but once you submit, that’s what we’ll review. Here an example entry pinned at the top of the Contest Entries page you should follow. Make sure to add these tags to your entry: "appworld 2026", "latam", and "irules" as shown on that example. IMPORTANT - You need to join the Contests group to submit your entry. New to iRules? Perfect! We welcome participants at all skill levels. If you’re just getting started, check out our Getting Started with iRules: Basic Concepts guide. This contest is a great opportunity to learn by doing. Feel free to bring your favorite colleagues and AI buddies to help craft your entry. Final Thoughts Post any and all of your contest-related questions in comments below. The iRules Contest has a rich history of surfacing creative solutions from the community. Approaching problems differently inspires some of the best ideas we've seen. We're looking forward to seeing and celebrating what you build. Learn it. Build it. Share it. See you at AppWorld LATAM 2026! AppWorld LATAM 2026 - Concurso “Escribe tu Primer iRule” ¡Hola querida comunidad! El Concurso de iRules está de regreso, con un nuevo estilo. Los iRules de Las Vegas y Berlín demostraron una experiencia increíble. Para este tercer Concurso de iRules, cambiaremos el enfoque hacia el estímulo y la educación con el tema: Concurso Comunitario “Escribe tu Primer iRule”. Estamos desafiando a los miembros de la comunidad DevCentral que asistan a AppWorld LATAM 2026 a diseñar y construir un iRule en un entorno acogedor. Ya sea que estés escribiendo un iRule por primera vez, o apenas estés encontrando tu ritmo, no podemos esperar a ver lo que crees. (Y no te preocupes, no tiene que ser literalmente tu primer iRule. Lo que cuenta es el espíritu de intentar algo nuevo.) El Desafío Planea y escribe un iRule que aborde un caso de uso de las capacidades de BIG-IP. Puedes: Crear un nuevo iRule Reimaginar los iRules existentes del codeshare de DevCentral Adaptar un iRule de 20 líneas o menos del GitHub iRules Toolbox Valoramos tu perspectiva fresca y tu mirada renovada. Como es una oportunidad de aprendizaje, también te animamos a divertirte con ello. Premios Las presentaciones serán evaluadas para los premios por categoría. Todos los participantes reciben una camiseta exclusiva del concurso. Puesto Premio Premios por Categoría $200/cada uno Premio a la Excelencia Técnica $500 Participación camiseta ¿Qué Hace a una Entrada Ganadora? Los criterios de evaluación de 100 puntos para las presentaciones se definen a continuación en cuatro categorías: Excelencia Técnica (25 puntos) ¿Está bien construido y listo para producción? Considera: Funciona correctamente Consciente del rendimiento (eficiente, impacto mínimo en recursos) Sigue las mejores prácticas de seguridad Código limpio y legible Impacto en el Usuario (25 puntos) ¿Tú y otros usuarios realmente lo usarían? Considera: Resuelve un problema operativo real o una necesidad técnica Aplicabilidad práctica y potencial de adopción Valor de negocio claro Documentación exhaustiva Innovación y Creatividad (25 puntos) ¿Esta solución muestra un pensamiento original? Considera: Perspectiva fresca sobre desafíos comunes Enfoque único para resolver un problema moderno ¿Inspira colaboración y progreso? Tema y Alineación (25 puntos) ¿Este iRule refleja tu aprendizaje de AppWorld LATAM 2026 y de los recursos de la comunidad? Considera: Aplicar el conocimiento y las habilidades que has aprendido Accesible para otros nuevos escritores de iRules Demuestra tu esfuerzo por intentar algo nuevo para ti Fechas Importantes Apertura del Concurso: 8 de junio de 2026 a las 12:00 a.m. Hora del Pacífico Fecha Límite de Presentación: 31 de julio de 2026 a las 11:59 p.m. Hora del Pacífico Anuncio de Ganadores: 14 de agosto de 2026 Cómo Participar El concurso está abierto a todos los socios y clientes de F5, y miembros de DevCentral que estén registrados y asistan al concurso en AppWorld LATAM 2026, excepto como se describe en las Reglas Oficiales. Por favor consulta las Reglas Oficiales para los términos completos, incluidas las condiciones de participación y elegibilidad. Regístrate en DevCentral y únete al grupo Community Contests. Busca a Hannah o Buu en el área de la Comunidad si necesitas ayuda. Construye y envía antes de las 11:59 p.m. Hora del Pacífico del 31 de JULIO de 2026. Edita tu borrador tanto como quieras, pero una vez que lo envíes, eso es lo que revisaremos. Aquí tienes un ejemplo de entrada anclado al inicio de la página de Contest Entries que deberías seguir. Asegúrate de agregar estas etiquetas a tu entrada: “appworld 2026”, “latam” e “irules” como se muestra en ese ejemplo. IMPORTANTE - Necesitas unirte al grupo Contests para enviar tu entrada. ¿Nuevo en iRules? ¡Perfecto! Damos la bienvenida a participantes de todos los niveles de habilidad. Si recién estás comenzando, consulta nuestra guía Getting Started with iRules: Basic Concepts. Este concurso es una gran oportunidad para aprender haciendo. Siéntete libre de traer a tus colegas favoritos y a tus compañeros de IA para ayudarte a crear tu entrada. Reflexiones Finales Publica todas tus preguntas relacionadas con el concurso en los comentarios a continuación. El Concurso de iRules tiene una rica historia de hacer emerger soluciones creativas desde la comunidad. Abordar los problemas de manera diferente inspira algunas de las mejores ideas que hemos visto. Esperamos con ansias ver y celebrar lo que construyas. Apréndelo. Constrúyelo. Compártelo.389Views2likes0CommentsExplicit write control for iRules subtables
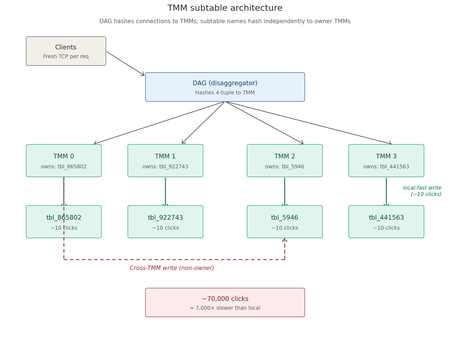
Note to the reader...apparently what is old is new again. There are some threads here on DevCentral that have already solved for this, albeit in different ways. The few brought to my attention by MVP Kai_Wilke are included in the list below for your benefit to read through. That said, the journey of discovery here in this article is worth your time to understand the nuances of how data is passed in a multi-TMM system. Dealing with iRule $variables for HTTP2 workload while HTTP MRF Router is enabled | DevCentral https://github.com/KaiWilke/F5-iRule-RADIUS-Server-Stack SPDY/HTTP2 Profile Impact on Variable Use | DevCentral The TL;DR TMM subtables on BIG-IP are partitioned across TMMs by hashing the subtable name. Writing to a subtable from a non-owner TMM is roughly 1000x slower than writing from the owner...single-digit clock clicks vs. tens of thousands. If you want fast per-TMM local storage, you cannot pick the subtable name yourself; you have to *discover* a locally-owned name by timing trial writes. Deterministic naming schemes do not work, even when they look obviously correct. The Problem A colleague had an iRule that maintained per-connection state across many CLIENT_DATA events. The natural data structure was a TMM session subtable. His quick experimenting showed the writes were slow enough to push the system CPU under modest load and needed to understand why before scaling further. There's an example proc library from Nat_Thirasuttakorn "LOCALDB" that uses a clever timing trick: it generates a random subtable name, times a probe write, and only keeps the name if the write completes under some threshold (50 clock clicks in the original). The implication was that most random names produce slow writes and only a few are fast. I read the code, figured I understood it, and rewrote it "cleanly" using deterministic per-TMM names: `localdb_tmm_0`, `localdb_tmm_1`, `localdb_tmm_2`, ... one per TMM, no probing required. Each TMM would write only to its own name. Done, right? Wrong. The diagram above is the mental model the rest of this post leans on. Two independent hashes are happening: the DAG hashes the inbound 4-tuple to choose which TMM accepts the connection, and TMOS separately hashes the subtable name to choose which TMM *owns* the storage for that name. A write succeeds only when both hashes agree; when the TMM that received the connection is also the owner of the subtable being written to. When they disagree, the write costs roughly 7000x more. The Investigation The deterministic version "worked" — writes succeeded, distribution looked plausible, throughput was decent. Then I added timing instrumentation per TMM and looked at the percentiles: TMM samples min avg max 0 74 121 64855.6 229089 1 34 136 71536.3 236204 2 38 121 88516.9 293259 3 62 3 13.3 25 TMM 3 was writing in 3-25 clicks. Every other TMM was averaging tens of thousands, which is a 5,000-7,000x gap! Something was very wrong. The diagnosis came from a `/probe` endpoint I'd added for unrelated reasons: hit the same subtable name from many connections, time each write, count which TMM responds fast. Probing each of the four "deterministic" names produced: localdb_tmm_0 → owner is TMM 2 localdb_tmm_1 → owner is TMM 2 localdb_tmm_2 → owner is TMM 3 localdb_tmm_3 → owner is TMM 3 Visualizing the result for one of those probes makes the signal unambiguous: Two of the four names hashed to TMM 2, the other two hashed to TMM 3. TMMs 0 and 1 didn't own any of the subtables I'd "assigned" to them. This is the key insight: **the subtable name `localdb_tmm_3` doesn't get owned by TMM 3 just because its name ends in 3.** TMOS hashes the whole name string and assigns ownership based on that hash. The hash is opaque, and it's stable, but it has no relationship to the content of the name. My deterministic scheme was generating four unique names, which guaranteed no key collisions across TMMs — but it didn't guarantee, and couldn't guarantee, that name N landed on TMM N. Why The Original Trick Was Right Going back to the LOCALDB proc library pattern from DevCentral: while { $try < $maxtry } { set name [expr rand()] set before [clock clicks] table set -subtable $name test_$name $name 5 set after [clock clicks] set diff [expr {$after - $before}] if { $diff < $maxdiff } { break } incr try } Generate a random name. Probe it. If it's fast, keep it; if not, throw it away and try another. Each TMM independently does this, and on average needs ~N tries on an N-TMM system to find a name it owns. The probe is the *only* reliable way to know. The randomness is load-bearing. The timing measurement is load-bearing. Neither is decorative. My "elegant" rewrite removed both and produced a system that looked fine but was burning 99% of its potential throughput shipping writes between TMMs. How to Verify A timing histogram per TMM is the diagnostic. The test workflow: Add a `/probe?name=X` endpoint that times a single `table set` against an arbitrary subtable name and reports clicks + the responding TMM Hit it many times from a multi-threaded client Aggregate per-TMM: hits, OWNER count (writes under threshold), NON_OWNER count, min/avg/max clicks The owner of name X will show up as ~all-OWNER with consistently low clicks; everyone else shows ~all-NON_OWNER with high clicks A handful of stray "OWNER" tags on non-owners is just noisy variance in `clock clicks` measurement. The real signal is overwhelming: 50+ OWNER tags vs 0-3 OWNER tags, and average clicks differing by 1000-10000x. Lessons About TMM Subtables A few things worth internalizing if you work with these: Names are global; storage is partitioned Two TMMs writing the same name reach the same logical subtable, but only the owner stores it locally. Non-owners pay an inter-TMM coordination tax on every operation. This is fundamentally a sharding scheme where the shard key is the subtable name and the shard map is hidden from you. Construction can't replace discovery Anywhere a system uses an opaque hash to assign ownership of named resources, you cannot construct a locally-owned name, you can only find one by trying. This pattern shows up well beyond TMOS: Cassandra token ranges, Redis Cluster slots, Kafka partition assignments, consistent-hashing rings in general. Discovery beats construction whenever the mapping function is hidden. O(n) reads in hot paths kill throughput I had a `count` proc that called `table keys -subtable X` and ran `llength` on the result. With per-TMM subtables of ~25k entries, that's 25k strings to enumerate per request. Throughput decayed from 3300/s to 600/s over a 40k-record run, a perfect 1/n curve. Maintaining the count incrementally in a `static::` variable made it O(1) and throughput stayed flat. The fix is obvious in hindsight; the bug is invisible without per-second throughput measurement. Static variables are per-TMM This is great when you want it (per-TMM owned-subtable name, per-TMM counters) and confusing when you don't (you can't share state across TMMs through statics alone). The variables are also persistent across rule reloads in some versions, which means a rule update that adds a new static can leave you with TMMs running the new code but missing the new state. Defensive existence checks at the top of every proc are worthwhile. Sampling debug logs is mandatory at scale Logging every write to `/var/log/ltm` for a million-record load is 1M log lines, hundreds of MB, and enough log I/O to tank throughput on its own. Sample 1-in-N (where N grows with load size), and gate calling-rule logs on the same sample point so the log narrative stays coherent. A `should_log` helper proc shared between the library and its callers keeps this clean. Test harnesses should reset, not reload I initially "reset" between runs by reloading the iRule. `RULE_INIT` re-ran and statics reset, but the *subtable contents* persisted in TMM session memory because they're indexed by name, not by rule. Each rule reload picked a new random name and orphaned the old subtable's entries. Over many runs, memory accumulated. A `/reset` endpoint that walks `table keys` and deletes them is the right abstraction. What "Done" Looked Like After the fix, a 100k-record run on a 4-TMM system: TMM samples min avg max 0 98 3 17.4 71 1 101 4 18.9 88 2 99 3 16.8 77 3 102 4 19.1 91 Throughput stayed flat at ~3000/s for the entire run. Every TMM in the same low-clicks range. No `SLOW` tags in the sampled logs. The before-and-after chart (log scale) makes the impact unmistakable: TMM 3 is interesting on its own. Under the broken design it was already fast (averaging 13.3 clicks) because the deterministic names happened to hash to it, meaning every other TMM was ferrying its writes over to TMM 3. Under the fix, TMM 3 stops being a single hot point and instead does roughly the same work as everyone else, on its own subtable. The fact that TMM 3's "broken" bar isn't dramatically taller is what makes this kind of bug survive a smoke test: writes were succeeding, throughput looked plausible, *one* TMM was even fast. The percentile breakdown is what gave it away. The Validated Test Session Here is the actual end-to-end verification run, command by command, on a 4-TMM lab BIG-IP. This is the workflow that I ended up codifying in the project's `USAGE.md` — it both validates that the fix works and demonstrates each tool's role. Step 1: Verify Every TMM Picked a Unique Subtable After deploying the LOCALDB rule and the calling rule, hit `/whoami` enough times that fresh TCP connections fan out across all TMMs: $ for i in $(seq 1 30); do curl -s http://10.0.2.49/whoami; done | sort -u tmm 0 subtable localdb_tmm_0_865802 total_tmms 4 writes 0 entries 0 tmm 1 subtable localdb_tmm_1_922743 total_tmms 4 writes 0 entries 0 tmm 2 subtable localdb_tmm_2_5946 total_tmms 4 writes 0 entries 0 tmm 3 subtable localdb_tmm_3_441563 total_tmms 4 writes 0 entries 0 Four things to read out of this: Four unique TMMs (0, 1, 2, 3) responded meaning full coverage. With `Connection: close` from curl, each request gets a fresh ephemeral source port and the BIG-IP's DAG re-hashes; 30 requests against 4 TMMs is essentially guaranteed to hit all of them. Four unique subtable names, each with the responding TMM number as a prefix and a random suffix. The TMM-number prefix is just a label for human readability. The random suffix is what `init_table` actually iterates on during timing-probe discovery, throwing away names that hash to other TMMs and keeping the first one whose write completes under the threshold. `total_tmms=4` is consistent on every row. `TMM::cmp_count` is reporting the cluster size correctly. writes=0 entries=0` everywhere. Clean baseline before any load. Step 2: Reset to a Clean Baseline $ python tbl-loader.py reset --host 10.0.2.49 --port 80 Discovering TMM count from 10.0.2.49:80/info ... BIG-IP reports 4 TMMs. Sending 200 /reset requests with 32 workers... Reset summary: TMM hits first_deleted total_deleted ------------------------------------------ 0 50 0 0 1 47 0 0 2 55 0 0 3 48 0 0 All 4 TMMs cleared. Total entries removed (first-hit): 0 200 reset requests, 50 / 47 / 55 / 48 distribution across the four TMMs. That's essentially perfect uniform. Expected mean is 50, observed range is 47-55, which is well within the natural variance of a fair hash. Worth confirming because the same DAG is what'll spread the load run; uneven reset distribution would predict uneven load distribution, which complicates the analysis. `first_deleted=0` everywhere because the previous step's `whoami` had already shown empty subtables. After a load run, this column tells you exactly how many entries each TMM was holding. Step 3: Run the Load $ python tbl-loader.py load --host 10.0.2.49 --port 80 --count 100000 --workers 64 ... completed=100,000/100,000 (100.0%) rate=4376/s coverage=4/4 missing=[] errors=0 Done. completed=100,000 errors=0 elapsed=22.9s rate=4375/s Final distribution: tmm 0: 25,198 writes (25.20%) tmm 1: 24,782 writes (24.78%) tmm 2: 24,914 writes (24.91%) tmm 3: 25,106 writes (25.11%) Three numbers worth lingering on: Sustained 4,375/s throughput, completely flat Earlier in the project, before the O(1) `count` fix, the equivalent run started at 3,300/s and decayed to 600/s by the 40k-record mark, a perfect 1/n curve from the hidden `table keys` + `llength` cost in the calling rule. With `static::LOCALDB_entries` maintained incrementally, the per-write work is genuinely constant and throughput stays where it starts. Distribution within ±0.25% of perfect uniform 25.20% / 24.78% / 24.91% / 25.11% is what fair hashing produces over 100k samples. The DAG is doing its job; nothing is being funneled through one TMM the way the broken-locality version was. Zero errors over 100k fresh TCP connections No TIME_WAIT exhaustion on the client (the ephemeral port range is wide enough), no rate limiting on the BIG-IP, no socket timeouts. Suggests the workload is well within both ends' capacity. The 22.9 second elapsed time works out to ~5 microseconds per write end-to-end, including the full TCP setup/teardown for each request. The actual `table set` is in the tens of clock clicks (single-digit microseconds), so HTTP and TCP overhead dominate, which is the right answer when the iRule work itself is fast and local. Step 4: Verify Per-TMM Locality from the Logs The throughput and distribution numbers tell us writes are happening evenly, but they don't directly prove each write is *local*. For that, pull the sampled timing lines from the BIG-IP's log and run them through the analyzer. Filter to the test window so earlier (broken) runs don't pollute the stats: $ ssh [email protected] "grep '^May 6 16' /var/log/ltm | grep 'sampled'" \ | python3 timing_stats.py Sample rate: 1/1000 Locality threshold: 100 clicks TMM n FAST SLOW min p50 avg p95 p99 max ------------------------------------------------------------------------------ 0 25 25 0 3 5 5.5 10 11 11 1 24 24 0 3 5 6.1 11 18 18 2 24 24 0 2 6 6.1 10 11 11 3 25 25 0 2 6 6.5 12 13 13 ------------------------------------------------------------------------------ Total: 98 samples across 4 TMMs FAST_LOCAL=98 SLOW=0 OK: all TMMs have average write timing below 100 clicks. Per-TMM locality is working. This is the centerpiece of the validation. Reading it line by line: Sample counts 25 / 24 / 24 / 25 samples per TMM matches the 25.20% / 24.78% / 24.91% / 25.11% write distribution from the load output, which is what you'd expect if the BIG-IP is logging 1-in-1000 of all writes uniformly. Timing Single-digit minimums (2-3 clicks). Averages of 5.5-6.5 clicks. p99s of 11-18. Max of 18 across all 98 samples. Compare to the broken run earlier in the project (shown at the top of the article in the investigation section), on the same hardware with the same workload but the wrong `init_table`. That's a **10,000x improvement on three of the four TMMs** between the two runs. The only thing that changed was `init_table` switching from deterministic naming to timing-probe discovery. Tag tally 98 FAST_LOCAL, 0 SLOW. Not a single sampled write missed the locality threshold. The 100-click threshold has plenty of headroom, the actual max was 18, an order of magnitude below. Verdict The script's automated check confirms locality is working. This is the line you'd grep for in CI if you wanted regression coverage. Step 5: Spot-Check Ownership of a Discovered Name The timing report proves writes were fast, but it doesn't prove that the *names* each TMM picked are actually owned by those TMMs (only that their writes were fast for whatever reason). To close that gap, take one of the names from `whoami` and probe it directly: $ python tbl-loader.py probe --host 10.0.2.49 --port 80 --name localdb_tmm_2_5946 --requests 200 ... Results for subtable 'localdb_tmm_2_5946': TMM hits OWNER NON_OWNER min_clicks avg_clicks max_clicks ---------------------------------------------------------------- 0 55 0 55 286 5139.9 19814 1 70 0 70 127 12475.3 52544 2 8 8 0 3 8.6 20 3 67 0 67 238 7126.6 51939 Likely owner of subtable 'localdb_tmm_2_5946': TMM 2 (avg 8.6 clicks, tagged OWNER 8 times) This is unambiguous: TMM 2 wrote in 3-20 clicks, average 8.6 Consistent with the 6.1 average from `timing_stats.py` during the load. Small differences, both well under threshold, both unambiguously local. TMMs 0, 1, 3 took 127-52,544 clicks, averages 5,139 / 12,475 / 7,126 Roughly 600x to 1,500x slower than TMM 2 on the same operation. They're paying the inter-TMM coordination tax because the subtable is owned by TMM 2. Zero stray OWNER tags on non-owning TMMs Earlier probe runs against fresh subtables sometimes had 1-3 stray OWNER tags from non-owners due to `clock clicks` jitter on small subtables. With this subtable now containing ~25k entries, the non-owner penalty is large enough (mins of 127-286 clicks) that no stray write made it under the 100-click threshold. The bigger the subtable, the cleaner the signal. TMM 2 only got 8 hits That's just sampling variance. The DAG hashed inbound connections 55 / 70 / 8 / 67, which over 200 requests is a normal-looking spread. With 1000 requests you'd see ~250 hits per TMM. The 8 hits TMM 2 did get were unanimous on OWNER, which is what matters. A run against any of the other discovered names (`localdb_tmm_0_865802`, `localdb_tmm_1_922743`, `localdb_tmm_3_441563`) produces the same shape of result with the corresponding TMM as owner. What This Validates Step 1 proves every TMM ran `init_table` and picked a unique name. Step 2 proves clean baseline and even DAG distribution. Step 3 proves throughput is sustained and writes spread evenly across TMMs at scale. Step 4 proves every write was fast at the time it happened. Step 5 proves the names each TMM picked are genuinely owned by those TMMs. Together they're a complete proof of the design: the timing-probe discovery in `init_table` correctly identifies a locally-owned subtable name on each TMM, and operations against those names cost ~10 clock clicks instead of ~70,000. The cost gap is the entire reason the per-TMM-subtable pattern exists, and it's now empirically demonstrated end-to-end. This validation run took maybe three minutes of wall time. It's the kind of verification I should have been running before believing the original "deterministic naming" rewrite worked, not after watching it fail under load. Pushing Throughput: Per-Write to Bulk-POST The validated workflow above writes one key per HTTP request. That's the right shape for testing locality (each write is a clean, isolated trial), but it makes TCP connection setup the dominant cost. At ~4,375 writes per second on a 4-TMM box, the iRule is spending most of its time accepting connections, parsing headers, and tearing down sockets, not writing to subtables. The natural next step is to batch many writes into a single HTTP request. A separate `/bulk_load` endpoint accepts a POST body of newline-separated keys (UUIDs in our test case), collects the body via `HTTP::collect`, and walks the lines in a tight loop calling `LOCALDB::set_unique` on each. One TCP connection now writes 15,625 keys instead of one. Per-batch timing comes back in the response so the loader can aggregate it client-side. The throughput result is striking: Same hardware, same iRule logic, same per-TMM locality — the 30× gap is purely TCP setup cost saved. The per-write timing inside the iRule barely changed (3-6 clicks per `LOCALDB::set_unique` either way), but the request-level overhead collapsed because we stopped paying it 1M times. A few things worth noting about this bulk path that aren't obvious: Locality holds inside the loop A `/bulk_load` request that lands on TMM 2 will do all 15,625 of its writes against TMM 2's local subtable. There's no opportunity for a single batch to "leak" writes to other TMMs, because the connection is pinned to one TMM by DAG and the subtable name is fixed by `static::LOCALDB_name`. So the locality verdict from the per-write test carries over without needing re-verification and the loader's per-batch `clicks_per_write` measurement confirms it stays in the 3-6 click range. DAG fan-out still distributes work With 64 fresh POSTs, each gets its own ephemeral source port, so the DAG hashes them across TMMs the same way it did with single-write requests. After enough batches, the per-TMM POST counts converge. In one of the runs, 4 TMMs each took exactly 16 of 64 POSTs. Body size matters for HTTP::collect The `/bulk_load` handler reads `Content-Length` and calls `HTTP::collect $cl` to buffer the entire body before processing. We cap at 16 MiB to protect TMM memory; that's plenty of headroom (~400k UUIDs per batch) but it's a real ceiling worth knowing about. The default of 15,625 UUIDs is ~580 KiB, which is well within bounds. An aside: log volume kills throughput at this rate Our first three bulk-post runs showed throughput drifting downward across consecutive runs...163k/s, then 129k/s, then 122k/s on the same hardware with no other state changes between them. The cause turned out to be the calling rule's logging itself. The `/bulk_load` and `/reset` handlers each had unconditional `log local0.` statements, producing 64 + 200 = 264 syslog writes per test cycle on top of the LOCALDB sample logs. After silencing those handlers (the response bodies already carried the per-batch timing data, so we lost no visibility), runs stabilized at ~133k writes/s ± 4% and survived 60-second sleeps with no warmup penalty. The lesson generalizes: at high write rates, the rule path needs to be quiet, not just "not chatty." Even gated log statements run their gate evaluation on every request, and unconditional ones write to syslog regardless of intent. When the per-write iRule cost is in the single-digit microseconds, *any* per-request work shows up. The rule of thumb that emerged: log statements that fire once per HTTP request are fine for diagnostics (`/probe`, `/whoami`) but should be sampled or removed entirely from the hot path (`/load`, `/bulk_load`, `/reset`). The loader can carry timing data back in response bodies and aggregate it client-side, which is both faster and more useful for analysis. Worth flagging that the absolute throughput numbers here (130-160k writes/s) reflect the test environment: a BIG-IP VE running on an Intel NUC under VMware, sharing the host with the load generator and other VMs. Those are not headroom numbers; they're contention-dominated. A 16-vCPU appliance without that contention should comfortably scale 5-10× from these figures, putting bulk-load throughput into the millions of writes per second on real hardware. The Code The updated `LOCALDB.tcl`, the test harness `subtable_test_updates.tcl`, the Python loader/prober/timing-analyzer, and the USAGE.md are all in the irules-subtable-discovery repo out on Github. Two key bits to study: The `init_table` proc that does the timing-probe discovery, including the fallback path that logs a WARNING and uses a slow name rather than failing silently when discovery exhausts its tries. The 200-try ceiling is sized for 16+ TMMs; on a 4-TMM box you'll typically find a local name in 1-3 tries. The `/probe` endpoint and the loader's `probe` mode. Together they let you take any subtable name and identify which TMM owns it in seconds. Worth keeping in your toolkit; it's the cleanest way I've found to interrogate TMOS's hash assignments. Closing Thoughts The whole episode reinforced something I keep relearning: when a working pattern looks weirdly complicated, the complications are usually load-bearing. The original LOCALDB rule looked over-engineered with its random names and timing probes and retry loops. It was actually exactly as engineered as it needed to be. My "cleaner" rewrite was simpler because I'd quietly assumed something untrue about how TMOS assigns ownership. The truth was readable from a 6-line timing report; I just hadn't generated one yet. If you're going to deviate from a working pattern, the deviation should be the thing you instrument first. Note: the original LocalDB proc library I built this from has been updated by the author in a couple different ways since I shared my work with him. I didn't fold that work in here, but I'll post those updates along with the original when I get permission to do so.191Views2likes0Comments