availability
2776 TopicsHTTP Load Balancer Routes on F5 Distributed Cloud
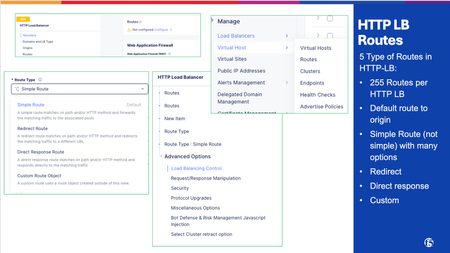
Route misconfiguration is one of the most common configuration mistakes we see that can cause incidents on F5 Distributed Cloud (F5 XC). The four route types look deceptively simple in the console, but they have distinct behaviors, ordering rules, and gotchas. This article covers all four types with real field names, decision guidance, and the mistakes that actually happen in production. What Routes Do in F5 XC HTTP Load Balancer An HTTP Load Balancer in F5 XC is a full L7 proxy running at the Regional Edge (RE) and depending on the deployment model, Customer Edge (CE). We will use the Regional Edge as a deployment model for this article. When a request arrives, the RE evaluates the route list in order and applies the first matching route. That route determines what happens to the request: forward it to an origin, redirect the client, return a synthetic response, or apply advanced routing logic. Routes can be configured inside the HTTP Load Balancer configuration which opens a new Route Options window: Multi-Cloud App Connect > Load Balancers > HTTP Load Balancers > [your LB] > Routes > Route Options The four route types map to three underlying route actions: XC Route Type Route Action Traffic Goes To Simple Route route Origin Pool Redirect Route redirect Client (3xx response) Direct Response Route direct_response Client (fixed response body) Custom Route route / redirect / direct_response Depends on configuration Route Matching: How XC Evaluates Routes Route evaluation is sequential, stops on first match, and has no automatic specificity ranking. The order you set is the order XC uses. Evaluation Order The HTTP Load Balancer evaluates routes sequentially, top to bottom. The first route that matches the incoming request wins. No further routes are evaluated. This means: More specific routes must appear before broader ones. A catch-all route (prefix /) at the top will swallow everything. Nothing below it will ever match. Path Match Types Three path match types are available across all route types: Match Type Field Behavior Prefix path_prefix Path must begin with the specified string Exact exact Path must equal the value exactly (query string excluded) Regex regex Entire path (minus query string) must match the regex pattern Prefix matching pitfall: The prefix /api matches /api/v1/users but also /apikeys and /api-internal. If you want to match a path segment boundary, use /api/ (trailing slash) or switch to regex. Additional Matching Criteria Beyond path, routes can match on: HTTP methods: GET, POST, PUT, DELETE, etc. Request headers: presence, exact value, regex Query parameters: Retain, Remove, or Replace Combining criteria (e.g., path prefix + method + header) creates an AND condition: all specified criteria must match. Route Type 1: Simple Routes Simple routes are the workhorse of most HTTP Load Balancer configurations. They match a path (and optionally method/headers) and forward traffic to an Origin Pool. When to Use Standard application traffic forwarding Path-based routing to different backend services API versioning (/v1/ → pool A, /v2/ → pool B) Microservice fanout from a single domain Key Configuration Fields Field Description Path match type Prefix / Exact / Regex HTTP Method Any, GET, POST, PUT, etc... Origin Pool The backend pool receiving the request Host Rewrite Method Disable/ Hostname / Header value: rewrites the Host header sent to origin Query Parameters Retain, Remove, Replace Advanced Options Worth Knowing Path rewriting (under Advanced Options): Disabled: path sent to origin unchanged Prefix Replacement: replaces the matched prefix with a new string (e.g., strip /api/v1 prefix before sending to origin) Regex-based: full regex substitution on the path Retry policy: The default retry policy is 1 retry on 5xx responses. Set this explicitly for your application in every route: Disabled: no retries; required for write operations Default: 1 retry on 5xx Custom: specify retry conditions, count, and interval Per-route WAF override: Each simple route can attach its own WAF App Firewall policy. This completely replaces the load balancer-level WAF for matching requests; it is not additive. Use this to enforce stricter rules on sensitive paths (e.g., /admin/) or to relax inspection on certain paths. Example: API Path Routing Route 1: Prefix /api/v2/ → origin-pool-v2 (exact origin for v2) Route 2: Prefix /api/v1/ → origin-pool-v1 (legacy backend) Route 3: Prefix /api/ → origin-pool-api (catch-all for API paths) Route 4: Prefix / → origin-pool-web (catch-all for everything else) Order matters here. If route 3 or 4 appeared first, routes 1 and 2 would never fire. Route Type 2: Redirect Routes Redirect routes return an HTTP 3xx response directly to the client. No origin pool is involved: the RE handles the response entirely. When to Use HTTP → HTTPS redirect (though XC has a dedicated LB-level toggle for this) Domain canonicalization (www.example.com → example.com) Legacy URL migrations (/old-path/ → /new-path/) Temporary redirects during maintenance or A/B migrations Key Configuration Fields Field Description Protocol HTTP or HTTPS Host Target FQDN; supports non-standard ports Redirect Path / URI Target path; if left unset, original URI is preserved (including query string) Response Code 301 (Permanent), 302 (Temporary), 307, 308 Redirect Behavior: URI Preservation When you leave the redirect path unset, XC preserves the original URI path and query string in the Location header. This is useful for protocol/host-only redirects where you just want to change the scheme or domain without touching the path. Example: Redirect all HTTP traffic to HTTPS on the same host: Protocol: HTTPS Host: same-as-request (leave blank or match domain) Path: (unset — preserve original URI) Code: 301 Redirect Route Limitations Simple redirect routes (defined directly on the LB) do not support custom header manipulation on the redirect response. If you need to inject headers (e.g., Cache-Control: no-store on the redirect response), use a Custom Route object instead. Route Type 3: Direct Response Routes Direct response routes return a fully synthetic HTTP response to the client. The request never reaches an origin pool: the RE generates the response itself. When to Use Health check endpoints that should always return 200 (e.g., /healthz) without touching the app Maintenance mode pages: serve a 503 with a message body while origin is down Blocking specific paths with a meaningful error body (vs. a generic deny) Canary or feature-flag placeholders that return 404 before the feature ships Robots.txt or security.txt served from the edge without an origin Key Configuration Fields Field Description HTTP Status Code Any valid HTTP status code (200, 403, 503, etc.) Response Body Static text or HTML body returned to client Path match Same prefix/exact/regex options as other route types Example: Edge-Served Health Check Path: Exact /healthz Method: GET Action: Direct Response Status: 200 Body: OK This responds to health probes from AWS ALB, Kubernetes ingress controllers, or uptime monitors without any load on the backend. Particularly useful during blue/green deployments when the app might not yet be healthy. Route Type 4: Custom Routes Custom routes reference standalone Route objects created separately in XC and attached to one or more HTTP Load Balancers. Unlike the other three types, they follow a service-mesh model rather than a traditional LB model. When to Use Custom Routes Weighted traffic splitting between origin pools (canary releases, blue/green) Request/response header manipulation not available on simple routes Advanced retry policies with specific conditions and intervals Traffic mirroring (shadow traffic to a secondary backend for testing) Reusable route logic shared across multiple load balancers Architecture: Route Objects vs. Inline Routes Inline routes (simple, redirect, direct response) are defined directly on the HTTP Load Balancer. Custom route objects are: Created as standalone objects under Multi-Cloud App Connect Referenced by the HTTP Load Balancer Reusable: multiple LBs can reference the same route object Weighted Clusters Custom routes enable weighted traffic splitting across multiple upstream clusters, equivalent to BIG-IP pool ratio weights or AWS ALB weighted target groups. Route: Prefix /api/ Cluster A (origin-pool-v2): weight 90 Cluster B (origin-pool-v1): weight 10 This is the correct mechanism for canary deployments and gradual traffic shifts on F5 XC. The weights are percentage-based and must sum to 100. Header Manipulation Custom routes support header operations at the route level, applied before forwarding to origin: Operation Direction Example Add header Request X-Forwarded-For: {client-ip} Remove header Request Strip Authorization before certain paths Add header Response Strict-Transport-Security: max-age=31536000 Remove header Response Strip Server header from responses Header manipulation runs in order: route-level → virtual host-level → route configuration-level. Retry Policies Route retry policies take complete precedence over any virtual host-level retry policy. Configure explicitly: Field Description Retry on Conditions: 5xx, gateway-error, reset, connect-failure, retriable-4xx Number of retries Integer Per-try timeout Timeout applied to each individual retry attempt Retry interval Base interval between retries Traffic Mirroring Mirror policies shadow a copy of each request to a secondary cluster. The mirrored request is fire-and-forget. Example: Testing a new backend version against live traffic without affecting users Security analysis pipelines Route Ordering and Priority Route order is the most common source of routing bugs in XC deployments. There is no automatic specificity ranking; you own the order. The Rules Routes evaluate top to bottom. First match wins. Evaluation stops. Disabling a route (via the Route Activation Status toggle) does not remove it: traffic falls through to the next matching route. Recommended Ordering Pattern Order routes from most specific to least specific: Exact paths first Exact /api/v2/auth/token 2. Specific prefixes next Prefix /api/v2/ 3. Broader prefixes after Prefix /api/ 4. Path-specific exceptions Exact /healthz 5. Catch-all last Prefix / Common Ordering Mistakes Mistake Symptom Fix Catch-all prefix / first All traffic hits one origin; other routes never fire Move catch-all to last position /api prefix before /api/v2/ V2 traffic hits wrong origin Reverse the order Disabled/Unused route above active route Traffic silently hits next route with different behavior Remove disabled routes; don't rely on toggle for permanent changes Redirect route below a prefix match Redirect never fires Move redirect above the prefix that would match it first Common Mistakes and Gotchas Prefix /api matches /apikeys. The prefix match does not anchor to path segment boundaries. /api matches /api/, /api/v1/, and also /apikeys, /api-docs. Use /api/ (trailing slash) or regex if segment boundary matters. Per-route WAF is a full replacement, not additive. Attaching a WAF policy to a route does not stack with the LB-level WAF. It replaces it entirely for that route. If your LB WAF is in blocking mode and you attach a route-level WAF in monitoring mode, that route is now in monitoring mode only. Custom routes enforce TLS: test before production. If your origin uses a self-signed certificate and you switch from a simple route to a custom route without uploading the Root CA, connections will fail. Test in a staging environment first. Header manipulation on redirect requires a custom route object. Simple redirect routes in XC do not support response header injection. If you need Cache-Control or Vary headers on your redirects, you must use a standalone custom route object with redirect action. Regex route performance at scale. Regex routes require full path evaluation on every request. At high request volumes, a large number of regex routes adds measurable CPU overhead compared to prefix or exact routes. Use regex only where prefix or exact matching is insufficient. FAQ Q: What is the difference between a Simple Route and a Custom Route? A: Simple routes are inline on the HTTP Load Balancer and forward traffic directly to an Origin Pool. Custom routes are standalone objects that use an Endpoints → Clusters → Routes model, support weighted traffic splits, header manipulation, and mirroring, but cannot reference Origin Pools directly. Q: Why is my catch-all route matching everything instead of the specific routes below it? A: Route evaluation stops at the first match. If your catch-all prefix (/) is above more specific routes, it wins every time. Move the catch-all to the last position in the list. Q: Can I use a Custom Route to send traffic directly to an F5 XC Origin Pool? A: No. Custom routes do not support Origin Pools directly. They use an Endpoints → Clusters → Routes abstraction. If you need weighted splitting with Origin Pool support, custom routes are not the right fit; simple routes forward to Origin Pools but do not support weighted clusters. Q: My POST requests are creating duplicate records and I traced it to XC retries. What is happening? A: The default retry policy on simple routes is "1 retry on 5xx." A POST that hits a 500 gets retried once, potentially double-writing. Set the retry policy to Disabled on any route handling non-idempotent operations (POST, PUT, PATCH, DELETE). Q: Does attaching a WAF policy to a route add rules on top of my LB-level WAF? A: No. Per-route WAF replaces the LB-level WAF entirely for requests matching that route. If your LB WAF is in blocking mode and the route WAF is in monitoring mode, those requests are evaluated in monitoring mode only. Q: My Custom Route TLS connections to origin are failing but the same origin works fine on a Simple Route. Why? A: Custom routes enforce strict TLS with no skip-verify option. Simple routes do not have this requirement. For custom routes, upload the Root CA certificate for your origin, or use the use_volterra_trusted_ca_url flag via the API for public CAs. Self-signed certs without the Root CA uploaded will fail silently. Q: I disabled a route in the console but traffic behavior changed unexpectedly. What happened? A: Disabling a route via the Route Activation toggle does not remove it from evaluation. Traffic falls through to the next matching route in the list. If that route is a broad catch-all, the behavior shift may look correct until something that depends on specific routing breaks. Remove routes you no longer need rather than toggling them off.474Views3likes4Comments
F5 in AWS Part 1 - AWS Networking Basics
Updated for Current Versions and Documentation Part 1 : AWS Networking Basics Part 2: Running BIG-IP in an EC2 Virtual Private Cloud Part 3: Advanced Topologies and More on Highly-Available Services Part 4: Orchestrating BIG-IP Application Services with Open-Source Tools Part 5: Cloud-init, Single-NIC, and Auto Scale Out of BIG-IP in v12 If you work in IT, and you haven’t been living under a rock, then you have likely heard of Amazon Web Services (AWS). There has been a substantial increase in the maturity and stability of the AWS Elastic Compute Cloud (EC2), but you are wondering – can I continue to leverage F5 services in AWS? In this series of blog posts, we will discuss the how and why of running F5 BIG-IP in EC2. In this specific article, we’ll start with the basics of the AWS EC2 and Virtual Private Cloud (VPC). Later in the series, we will discuss some of the considerations associated with running BIG-IP as compute instance in this environment, we’ll outline the best deployment models for your application in EC2, and how these deployment models can be automated using open-source tools. Note: AWS uses the terms "public" and "private" to refer to what F5 Networks has typically referred to as "external" and "internal" respectively. We will use this terms interchangeably. First, what is AWS? If you have read the story, you will know that the EC2 project began with an internal interest at Amazon to move away from messy, multi-tenant networks using VLANs for segregation. Instead, network engineers at Amazon wanted to build an entirely IP-based architecture. This vision morphed into the universe of application services available today. Of course, building multi-tenant, purely L3 networks at massive scale had implications for both security and redundancy (we’ll get to this later). Today, EC2 enables users to run applications and services on top of virtualized network, storage, and compute infrastructure, where hosts are deployed in the form of Amazon Machine Images (AMIs). These AMIs can either be private to the user or launched from the public AWS marketplace. Hosts can be added to elastic load balancing (ELB) groups and associated with publicly accessible IPs to implement a simple horizontal model for availability. AWS became truly relevant for the enterprise with the introduction of the Virtual Private Cloud service. VPCs enabled users to build virtual private networks at the IP layer. These private networks can be connected to on-premise configurations by way of a VPN Gateway, or connected to the internet via an Internet Gateway. When deploying hosts within a VPC, the user has a significant amount of control over how each host is attached to the network. For example, a host can be attached to multiple networks and given several public or private IPs on one or multiple interfaces. Further, users can control many of the security aspects they are used to configuring in an on-premise environment (albeit in a slightly different way), including network ACLs, routing, simple firewalling, DHCP options, etc. Lets talk about these and other important EC2 aspects and try to understand how they affect our application deployment strategy. L2 Restrictions As we mentioned above, one of the design goals of AWS was to remove layer 2 networking. This is a worthy accomplishment but we lose access to certain useful protocols, including ARP (and gratuitious ARP), broadcast and multi-cast groups, 802.1Q tagging. We can no longer use VLANs for some availability models, for quality of service management, or for tenant isolation. Network Interfaces For larger topologies, one of the largest impacts given the removal of 802.1Q protocol support is the number of subnets we can attach to a node in the network. Because in AWS each interface is attached as a layer 3 endpoint, we must add an interface for each subnet. This contrasts with traditional networks, where you can add VLANs to your trunk for each subnet via tagging. Even though we're in a virtual world, the number of virtual network interfaces (or Elastic Network Interfaces (ENIs) in AWS terminology) is also limited according to the EC2 instance size. Together, the limits on number of interfaces and mapping between interface and subnet effectively limit the number of directly connected networks we can attach to a device (like BIG-IP, for example). IP Addressing AWS offers two kinds of globally routable IP address; these are “Public IP Addresses” and “Elastic IP Address”. In the table below, we outlined some of the differences between these two types of IP addresses. You can probably figure out for yourself why we will want to use Elastic IPs with BIG-IP. Like interfaces, AWS limits the number of IPs in several ways, including the number of IPs that can be attached to an interface and the number of elastic IPs per AWS account. Table 1: Differences between Public and Elastic IP Addresses Public IP Elastic IP Released on device termination/disassociation YES NO Assignable to secondary interfaces NO YES Can be associated after launch NO YES Amazon provides more information on public and elastic IP addresses here: http://docs.aws.amazon.com/AWSEC2/latest/UserGuide/using-instance-addressing.html#concepts-public-addresses Each interface on an EC2 instance is given a private IP address. This IP address is routable locally through your subnet and assigned from the address range associated with the subnet to which your interface is attached. Multiple private secondary IP addresses can be attached to an interface, and is a useful technique for creating more complex topologies. The number of interfaces and private IPs per interface within an Amazon VPC are listed here: http://docs.aws.amazon.com/AWSEC2/latest/UserGuide/using-eni.html#AvailableIpPerENI NAT Instances, Subnets and Routing When creating a VPC using the wizard available in the AWS VPC web portal, several default configurations are possible. One of these configurations is “VPC with Public and Private subnets”. In this configuration, what if the instances on our private subnet wish to access the outside world? Because we cannot attach public or elastic IP address to instances within the private subnet, we must use NAT provided by AWS. Like BIG-IP and other network devices in EC2, the NAT instance will live as a compute node within your VPC. This is good way to allow outbound traffic from your internal servers, but to prevent those servers from receiving inbound traffic. When you create subnets manually or through the VPC wizard, you’ll note that each subnet has an associated routing table. These route tables may be updated to control traffic flow between instances and subnets in your VPC. Regions and Availability Zones We know quite a few number of people who have been confused by the concept of availabilty zones in EC2. To put it clearly, an availabilty zone is a physically isolated datacenter in a region. Regions may contain mulitple availability zones. Availabilty zones run on different networking and storage infrastructure, and depend on seperate power supplies and internet connections. Striping your application deployments across availability zones is a great way to provide redundancy and, perhaps a hot standby, but please note that these are not the same thing. Amazon does not mirror any data between zones on behalf of the customer. While VPCs can span availability zones, subnets may not. To close this blog post, we are fortunate enough to get a video walk through from Vladimir Bojkovic, Solution Architect at F5 Networks. He shows how to create a VPC with internal and external subnets as a practical demonstration of the concepts we discussed above.4.9KViews2likes4CommentsHow to correctly monitor a Database Oracle
we are configuring a monitor health for a Oracle database which has the next configuration parameters: Send String: select * from dual Response: X user:CONSULTA_ANALISTA password:xxxxxxx connection string: PRODM1 = (DESCRIPTION = (ADDRESS_LIST = (ADDRESS = (PROTOCOL = TCP)(HOST = %node_ip%)(PORT = %node_port%)) ) (CONNECT_DATA = (SID = PRODM1) ) ) Row:3 Column:1 alias address:172.20.1.73 alias service port:1527 the monitor doesn't work and the pool member never is seen up, i have looked at the debug of the connection and this is what i see in a portion of it: [root@ltm1:Active:Changes Pending] monitors tail -30 Common_BD_monitor_PDN-Common_BD-1527.log DATABASE=PRODM1 = (DESCRIPTION = (ADDRESS_LIST = (ADDRESS = (PROTOCOL = TCP)(HOST = %node_ip%)(PORT = %node_port%)) ) (CONNECT_DATA = (SID = PRODM1) ) ) DEBUG=yes MON_INST_LOG_NAME=/var/log/monitors/Common_BD_monitor_PDN-Common_BD-1527.log MON_TMPL_NAME=/Common/BD_monitor_PDN NODE_IP=::ffff:172.20.1.73 NODE_PORT=1527 PASSWORD=nc5gf56y RECVCOLUMN=1 RECVROW=3 RECV_I=X SEND=select * from dual USERNAME=CONSULTA_ANALISTA TMOS_RD: 0 (0) Daemon port: 1521 count='0' converts to '0' Command-line PID filename: /var/run/ORACLE__Common_BD_monitor_PDN_::ffff:172.20. 1.73-0_1527.pid PID file /var/run/DBDaemon-0.pid exists. Checking for correctness of PID. DBDaemon on port 1521 says its PID is 19578. PID matches EXCEPTION connecting to DBDaemon: fflush(): Connection reset by peer i have also tried putting all the info directly like this: ********** Debugging session beginning at: Mon Jul 6 17:07:02 2015 Arguments 1-2: ::ffff:172.20.1.73 1527 Environment variables: COUNT=0 DATABASE=PRODM1 = (DESCRIPTION = (ADDRESS_LIST = (ADDRESS = (PROTOCOL = TCP)(HOST = 172.20.1.73)(PORT = 1527)) ) (CONNECT_DATA = (SID = PRODM1) ) ) DEBUG=yes MON_INST_LOG_NAME=/var/log/monitors/Common_BD_monitor_PDN-Common_BD-1527.log MON_TMPL_NAME=/Common/BD_monitor_PDN NODE_IP=::ffff:172.20.1.73 NODE_PORT=1527 PASSWORD=nc5gf56y RECVCOLUMN=1 RECVROW=1 RECV_I=ok SEND=TNSPING 172.20.1.73 1527 USERNAME=CONSULTA_ANALISTA TMOS_RD: 0 (0) Daemon port: 1521 count='0' converts to '0' Command-line PID filename: /var/run/ORACLE__Common_BD_monitor_PDN_::ffff:172.20.1.73-0_1527.pid PID file /var/run/DBDaemon-0.pid exists. Checking for correctness of PID. DBDaemon on port 1521 says its PID is 19578. PID matches Asking daemon to ping remote database. Expected result not received: Database down, see /var/log/DBDaemon.log for details. Database down, see /var/log/DBDaemon.log for details. If i look into /var/log/DBDaemon.log; it isn't updating. It seems that somehow the process is attached to other monitor over port 1521 an maybe that is the origin of the conflicto and fail of Oracle monitoring: [root@ltm1:Active:Changes Pending] monitors ps -fe|grep DB root 19578 1 0 Jun16 ? Ssl 43:33 /usr/lib/jvm/jre-1.7.0-openjd k.x86_64/bin/java -cp /usr/lib/jvm/jre-1.7.0-openjdk.x86_64/lib/rt.jar:/usr/lib/ jvm/jre-1.7.0-openjdk.x86_64/lib/charsets.jar:/usr/share/monitors/mysql-connecto r-java.jar:/usr/share/monitors/DB_monitor.jar:/usr/share/monitors/sqljdbc4.jar:/ usr/share/monitors/ojdbc6.jar:/usr/share/monitors/postgresql-8.3-604.jdbc3.jar - Xmx64m com.f5.eav.DBDaemon 1521 19578 01.7KViews1like5Comments
Connections vs sessions
Hi all This is my first post so apologies if I'm breaking any standards. I'm having trouble figuring out the difference between connections and sessions. No matter how much I Google this, I'm not finding a simple answer. Let me phrase it this way...if you read the article on "LTM: Dueling Timeouts" (https://devcentral.f5.com/articles/ltm-dueling-timeouts), it says: "Persistence timeouts are actually idle timeouts for a session, rather than a single connection." Unfortunately that statement does not tell us anything meaningful unless the definition of a connection and session is clarified. Or to put it another way, if you consult the F5 V11 configuration guide as it relates to session persistence profiles (http://support.f5.com/kb/en-us/products/big-ip_ltm/manuals/product/ltm-concepts-11-1-0/ltm_persist_profiles.html), it says: "The primary reason for tracking and storing session data is to ensure that client requests are directed to the same pool member throughout the life of a session or during subsequent sessions." So my question here would be, what factors influence whether ongoing HTTP GET requests (as an example) constitute a single session, or subsequent sessions? I'd really appreciate somebody's help here as I know this is a fundamentally basic concept but I'm unable to find a definitive answer.5.6KViews1like5Comments
Building digital resilience to enable digital sovereignty
In 2025, cloud service outages significantly impacted enterprises worldwide, prompting urgent calls for improved digital resilience and sovereignty strategies. Organizations face regulatory pressures and costly disruptions, necessitating robust approaches to maintain continuity and trust in critical infrastructure sectors. Digital resilience defined: Digital resilience is the capability of an organization to prevent, detect, respond to, and recover from infrastructure failures or cyberattacks, including those originating externally, making it essential for modern business continuity. Frameworks guiding resilience: Key regulatory and industry frameworks such as NIST Cybersecurity Framework, ISO/IEC 27001, COBIT, ITIL, BCM, DORA, and APRA CPS 230 provide structured guidance on managing cybersecurity, operational resilience, and third-party risk, forming the governance foundation for resilience strategies. Strategies for resilience: Effective digital resilience involves mapping applications to appropriate deployment models like distributed and redundant deployments, implementing intelligent traffic management, adaptive security, network segmentation, automation with failover testing, and continuous monitoring through visibility and analytics. Resilience and digital sovereignty: Digital resilience intersects with emerging digital sovereignty requirements that emphasize data location and governance. Achieving combined goals involves antifragile architectures that limit disruption impact, adapt to threats, and improve through learning, supported by F5 ADSP.382Views1like1CommentSimplifying Application Health Monitoring with F5 BIG-IP
A simple agreement between BIG-IP administrators and application owners can foster smooth collaboration between teams. Application owners define their own simple or complex health monitors and agree to expose a conventional /health endpoint. When a /health endpoint responds with an HTTP 200 request, BIG-IP assumes the application is healthy based on the application owners' own criteria. The Challenge of Health Monitoring in Modern Environments F5 BIG-IP administrators in Network Operations (NetOps) teams often work with application teams because the BIG-IP acts as a full proxy, providing services like: TLS termination Load balancing Health monitoring Health checks are crucial for effective load balancing. The BIG-IP uses them to determine where to send traffic among back-end application servers. However, health monitoring frequently causes friction between teams. Problems with the Traditional Approach Traditionally, BIG-IP administrators create and maintain health monitors ranging from simple ICMP pings to complex monitors that: Simulate user transactions Verify HTTP response codes Validate payload contents Track application dependencies This leads to several issues: Knowledge Gap: NetOps may not fully grasp each application's intricacies. Change Management Overhead: Application updates require retesting monitors, causing delays. Production Risk: Monitors can break after application changes, incorrectly marking services as up/down. Team Friction: Troubleshooting failed health checks involves tedious back-and-forth between teams. A Cloud-Native Solution The cloud-native and microservices communities have patterns that elegantly solve these problems. One widely used pattern is the [health endpoint], which adapts well to BIG-IP environments. The /health Endpoint Convention Cloud-native applications commonly expose dedicated health endpoints like /health, /healthy, or /ready. These return standard status codes reflecting the application's state. The /health endpoint provides a clear contract between NetOps and application teams for BIG-IP integration. Implementing the Contract This approach establishes a simple agreement: Application Team Responsibilities: Implement /health to return HTTP 200 when the application is ready for traffic Define "healthy" based on application needs (database connectivity, dependencies, etc.) Maintain the health check logic as the application changes BIG-IP Team Responsibilities: Configure an HTTP monitor targeting the /health endpoint Treat 200 as "healthy", anything else as "unhealthy" Benefits of This Approach Aligned Expertise: Application teams define health based on their knowledge. Less Friction: BIG-IP configuration stays stable as applications evolve. Better Reliability: Health checks reflect true application health, including dependencies. Easier Troubleshooting: The /health endpoint can return detailed diagnostic info, but this is ignored by the BIG-IP and used strictly for troubleshooting. Implementation Examples F5 BIG-IP Health Monitor Configuration ltm monitor http /Common/app-health-monitor { defaults-from /Common/http destination *:* interval 5 recv 200 recv-disable none send "GET /health HTTP/1.1\r\nHost: example.com\r\nConnection: close\r\n\r\n" time-until-up 0 timeout 16 } Node.js Health Endpoint Implementation const express = require('express'); const app = express(); const port = 3000; app.get('/', (req, res) => { res.send('Application is running'); }); app.get('/health', async (req, res) => { try { const dbStatus = await checkDatabaseConnection(); const serviceStatus = await checkDependentServices(); if (dbStatus && serviceStatus) { return res.status(200).json({ status: 'healthy', database: 'connected', services: 'available', timestamp: new Date().toISOString() }); } res.status(503).json({ status: 'unhealthy', database: dbStatus ? 'connected' : 'disconnected', services: serviceStatus ? 'available' : 'unavailable', timestamp: new Date().toISOString() }); } catch (error) { res.status(500).json({ status: 'error', message: error.message, timestamp: new Date().toISOString() }); } }); async function checkDatabaseConnection() { // Check real database connection return true; } async function checkDependentServices() { // Check required service connections return true; } app.listen(port, () => { console.log(`Application listening at http://localhost:${port}`); }); Adopting this health check pattern can greatly reduce friction between NetOps and application teams while improving reliability. The simple contract of HTTP 200 for healthy provides the needed integration while letting each team focus on their expertise. For apps that can't implement a custom /health endpoint, BIG-IP admins can still use traditional ICMP or TCP port monitoring. However, these basic checks can't accurately reflect an app's true health and complex dependencies. This approach fosters collaboration and leverages the specialized knowledge of both network and application teams. The result is more reliable services and smoother operations.806Views1like0Comments
Back to Basics: Health Monitors and Load Balancing
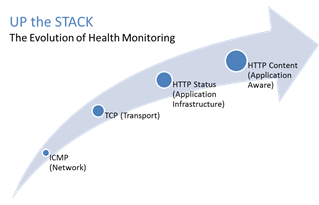
#webperf #ado Because every connection counts One of the truisms of architecting highly available systems is that you never, ever want to load balance a request to a system that is down. Therefore, some sort of health (status) monitoring is required. For applications, that means not just pinging the network interface or opening a TCP connection, it means querying the application and verifying that the response is valid. This, obviously, requires the application to respond. And respond often. Best practices suggest determining availability every 5 seconds or so. That means every X seconds the load balancing service is going to open up a connection to the application and make a request. Just like a user would do. That adds load to the application. It consumes network, transport, application and (possibly) database resources. Resources that cannot be used to service customers. While the impact on a single application may appear trivial, it's not. Remember, as load increases performance decreases. And no matter how trivial it may appear, health monitoring is adding load to what may be an already heavily loaded application. But Lori, you may be thinking, you expound on the importance of monitoring and visibility all the time! Are you saying we shouldn't be monitoring applications? Nope, not at all. Visibility is paramount, providing the actionable data necessary to enable highly dynamic, automated operations such as elasticity. Visibility through health-monitoring is a critical means of ensuring availability at both the local and global level. What we may need to do, however, is move from active to passive monitoring. PASSIVE MONITORING Passive monitoring, as the modifier suggests, is not an active process. The Load balancer does not open up connections nor query an application itself. Instead, it snoops on responses being returned to clients and from that infers the current status of the application. For example, if a request for content results in an HTTP error message, the load balancer can determine whether or not the application is available and capable of processing subsequent requests. If the load balancer is a BIG-IP, it can mark the service as "down" and invoke an active monitor to probe the application status as well as retrying the request to another available instance – insuring end-users do not see an error. Passive (inband) monitors are not binary. That is, they aren't simple "on" or "off" based on HTTP status codes. Such monitors can be configured to track the number of failures and evaluate failure rates against a configurable failure interval. When such thresholds are exceeded, the application can then be marked as "down". Passive monitors aren't restricted to availability status, either. They can also monitor for performance (response time). Failure to meet response time expectations results in a failure, and the application continues to be watched for subsequent failures. Passive monitors are, like most inline/inband technologies, transparent. They quietly monitor traffic and act upon that traffic without adding overhead to the process. Passive monitoring gives operations the visibility necessary to enable predictable performance and to meet or exceed user expectations with respect to uptime, without negatively impacting performance or capacity of the applications it is monitoring.3.2KViews1like2CommentsThe Limits of Cloud: Gratuitous ARP and Failover
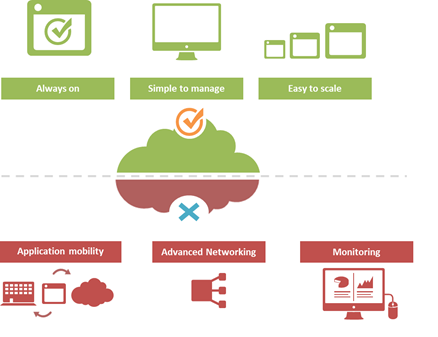
#Cloud is great at many things. At other things, not so much. Understanding the limitations of cloud will better enable a successful migration strategy. One of the truisms of technology is that takes a few years of adoption before folks really start figuring out what it excels at – and conversely what it doesn't. That's generally because early adoption is focused on lab-style experimentation that rarely extends beyond basic needs. It's when adoption reaches critical mass and folks start trying to use the technology to implement more advanced architectures that the "gotchas" start to be discovered. Cloud is no exception. A few of the things we've learned over the past years of adoption is that cloud is always on, it's simple to manage, and it makes applications and infrastructure services easy to scale. Some of the things we're learning now is that cloud isn't so great at supporting application mobility, monitoring of deployed services and at providing advanced networking capabilities. The reason that last part is so important is that a variety of enterprise-class capabilities we've come to rely upon are ultimately enabled by some of the advanced networking techniques cloud simply does not support. Take gratuitous ARP, for example. Most cloud providers do not allow or support this feature which ultimately means an inability to take advantage of higher-level functions traditionally taken for granted in the enterprise – like failover. GRATUITOUS ARP and ITS IMPLICATIONS For those unfamiliar with gratuitous ARP let's get you familiar with it quickly. A gratuitous ARP is an unsolicited ARP request made by a network element (host, switch, device, etc… ) to resolve its own IP address. The source and destination IP address are identical to the source IP address assigned to the network element. The destination MAC is a broadcast address. Gratuitous ARP is used for a variety of reasons. For example, if there is an ARP reply to the request, it means there exists an IP conflict. When a system first boots up, it will often send a gratuitous ARP to indicate it is "up" and available. And finally, it is used as the basis for load balancing failover. To ensure availability of load balancing services, two load balancers will share an IP address (often referred to as a floating IP). Upstream devices recognize the "primary" device by means of a simple ARP entry associating the floating IP with the active device. If the active device fails, the secondary immediately notices (due to heartbeat monitoring between the two) and will send out a gratuitous ARP indicating it is now associated with the IP address and won't the rest of the network please send subsequent traffic to it rather than the failed primary. VRRP and HSRP may also use gratuitous ARP to implement router failover. Most cloud environments do not allow broadcast traffic of this nature. After all, it's practically guaranteed that you are sharing a network segment with other tenants, and thus broadcasting traffic could certainly disrupt other tenant's traffic. Additionally, as security minded folks will be eager to remind us, it is fairly well-established that the default for accepting gratuitous ARPs on the network should be "don't do it". The astute observer will realize the reason for this; there is no security, no ability to verify, no authentication, nothing. A network element configured to accept gratuitous ARPs does so at the risk of being tricked into trusting, explicitly, every gratuitous ARP – even those that may be attempting to fool the network into believing it is a device it is not supposed to be. That, in essence, is ARP poisoning, and it's one of the security risks associated with the use of gratuitous ARP. Granted, someone needs to be physically on the network to pull this off, but in a cloud environment that's not nearly as difficult as it might be on a locked down corporate network. Gratuitous ARP can further be used to execute denial of service, man in the middle and MAC flooding attacks. None of which have particularly pleasant outcomes, especially in a cloud environment where such attacks would be against shared infrastructure, potentially impacting many tenants. Thus cloud providers are understandably leery about allowing network elements to willy-nilly announce their own IP addresses. That said, most enterprise-class network elements have implemented protections against these attacks precisely because of the reliance on gratuitous ARP for various infrastructure services. Most of these protections use a technique that will tentatively accept a gratuitous ARP, but not enter it in its ARP cache unless it has a valid IP-to-MAC mapping, as defined by the device configuration. Validation can take the form of matching against DHCP-assigned addresses or existence in a trusted database. Obviously these techniques would put an undue burden on a cloud provider's network given that any IP address on a network segment might be assigned to a very large set of MAC addresses. Simply put, gratuitous ARP is not cloud-friendly, and thus it is you will be hard pressed to find a cloud provider that supports it. What does that mean? That means, ultimately, that failover mechanisms in the cloud cannot be based on traditional techniques unless a means to replicate gratuitous ARP functionality without its negative implications can be designed. Which means, unfortunately, that traditional failover architectures – even using enterprise-class load balancers in cloud environments – cannot really be implemented today. What that means for IT preparing to migrate business critical applications and services to cloud environments is a careful review of their requirements and of the cloud environment's capabilities to determine whether availability and uptime goals can – or cannot – be met using a combination of cloud and traditional load balancing services.1.4KViews1like0CommentsIP::addr and IPv6
Did you know that all address internal to tmm are kept in IPv6 format? If you’ve written external monitors, I’m guessing you knew this. In the external monitors, for IPv4 networks the IPv6 “header” is removed with the line: IP=`echo $1 | sed 's/::ffff://'` IPv4 address are stored in what’s called “IPv4-mapped” format. An IPv4-mapped address has its first 80 bits set to zero and the next 16 set to one, followed by the 32 bits of the IPv4 address. The prefix looks like this: 0000:0000:0000:0000:0000:ffff: (abbreviated as ::ffff:, which looks strickingly simliar—ok, identical—to the pattern stripped above) Notation of the IPv4 section of the IPv4-formatted address vary in implementations between ::ffff:192.168.1.1 and ::ffff:c0a8:c8c8, but only the latter notation (in hex) is supported. If you need the decimal version, you can extract it like so: % puts $x ::ffff:c0a8:c8c8 % if { [string range $x 0 6] == "::ffff:" } { scan [string range $x 7 end] "%2x%2x:%2x%2x" ip1 ip2 ip3 ip4 set ipv4addr "$ip1.$ip2.$ip3.$ip4" } 192.168.200.200 Address Comparisons The text format is not what controls whether the IP::addr command (nor the class command) does an IPv4 or IPv6 comparison. Whether or not the IP address is IPv4-mapped is what controls the comparison. The text format merely controls how the text is then translated into the internal IPv6 format (ie: whether it becomes a IPv4-mapped address or not). Normally, this is not an issue, however, if you are trying to compare an IPv6 address against an IPv4 address, then you really need to understand this mapping business. Also, it is not recommended to use 0.0.0.0/0.0.0.0 for testing whether something is IPv4 versus IPv6 as that is not really valid a IP address—using the 0.0.0.0 mask (technically the same as /0) is a loophole and ultimately, what you are doing is loading the equivalent form of a IPv4-mapped mask. Rather, you should just use the following to test whether it is an IPv4-mapped address: if { [IP::addr $IP1 equals ::ffff:0000:0000/96] } { log local0. “Yep, that’s an IPv4 address” } These notes are covered in the IP::addr wiki entry. Any updates to the command and/or supporting notes will exist there, so keep the links handy. Related Articles F5 Friday: 'IPv4 and IPv6 Can Coexist' or 'How to eat your cake ... Service Provider Series: Managing the ipv6 Migration IPv6 and the End of the World No More IPv4. You do have your IPv6 plan running now, right ... Question about IPv6 - BIGIP - DevCentral - F5 DevCentral ... Insert IPv6 address into header - DevCentral - F5 DevCentral ... Business Case for IPv6 - DevCentral - F5 DevCentral > Community ... We're sorry. The IPv4 address you are trying to reach has been ... Don MacVittie - F5 BIG-IP IPv6 Gateway Module1.5KViews1like1Comment