visibility
12 TopicsWhat’s new in F5 Insight for ADSP v1.1?
Introduction F5 Insight for ADSP, a key component of the F5 Application Delivery and Security Platform (ADSP), helps teams monitor and secure apps that are spread across hybrid, multi-cloud and AI environments. In this article, I’ll highlight some of the new features introduced in F5 Insight v1.1. Demo Video Disaster Recovery Now with enhanced User Workflows. The F5 Insight Disaster Recovery feature helps your system keep running even if one server fails. It works by maintaining two synchronized systems: Primary instance — Handles all active operations. Standby instance — A backup system that continuously syncs data from the primary. If the Primary fails or requires maintenance, you can “promote” the Standby to take over as the Primary. After fixing the first system, you can perform a “failback” to restore it to normal operation. Change to Default User Credentials on First Boot F5 Insight now supports a default user and random password login workflow. You can either use cloud-init (like previous version) or the default user credential option. NOTE: This applies to new installations, not upgrades. In previous versions of F5 Insight, the procedure to set the admin username/password involved utilizing the “cloud-init” function. There is now an alternative method for setting the admin username/password. A unique password will be generated at first boot, allowing administrators to log in for the first time using this password. This randomly generated password must be changed after initially logging in. UI Improvements Previous versions of F5 Insight dashboards with large data volumes could experience some performance degradation due to extensive configuration objects. This has been resolved by implementing comprehensive performance optimizations across the dashboard platform, enabling it to handle significantly larger datasets while maintaining a fast and responsive user experience. Upgrade Procedure You’ve probably never upgraded your F5 Insight version, so it’s time to learn how. First, download the updated software version from myf5.com. The updated software is distributed as a bundled gzipped tar file. Then, upload the new version to your F5 Insight from the About screen, then click Upgrade. After uploading the new version, select Start Upgrade. The upgrade will take several minutes. Conclusion The latest version of F5 Insight for ADSP offers expanded functionality with Disaster Recovery. It also provides a convenient alternative to “cloud-init” for setting the initial administrative username & password. Finally, there are several UI improvements aimed at making the user experience better and more seamless. Upgrade today to the latest version of F5 Insight for ADSP and enjoy the following benefits: Streamline the initial configuration of F5 Insight with the new default admin user and dynamically generated password. Enjoy expanded workflows with the Disaster Recovery feature. Benefit from the many UI improvements. Related Content Introducing F5 Insight for ADSP F5 Insight for ADSP – Initial Setup in VMware F5 Insight for ADSP - A Closer Look F5 Insight for ADSP Documentation F5 Insight Product Page F5 Insight Release Blog 438Views3likes0Comments
F5 Insight for ADSP – Initial Setup in VMware
Demo Video Initial VMware Configuration Download the ova file from myf5.com. In VMware choose the Create/Register VM option and choose Deploy a virtual machine from an OVF or OVA file. Continue through the install wizard, which will upload the ova file to your VMware server. Uncheck the option to Power on automatically so you can edit the VM properties prior to boot. Note: Thick Provision Lazy Zeroed is recommended for performance Edit the Virtual Hardware options and set the hardware settings as follows: Note: A 600 GB disk formatted to Thick Provision Lazy Zeroed is recommended for performance Switch to the VM Options tab and expand Advanced Scroll down and click Edit Configuration Click Add parameter and add the following: guestinfo.userdata.encoding = base64 Create a local cloud-config.yml file to set the administrative username and password: Be sure to change the admin password and make a note of it. Then you need to base64 encode the file. Return to the VMware Configuration Parameters screen and Add another parameter named “guestinfo.userdata” and paste the base64 encoded text in the Value. Click OK when done. After saving the VM settings, you are ready to power on your VM for the first time! Note: Refer to the F5 Insight on VMware Deployment Guide for further details on this procedure. Post Boot VM Settings Open the VM Console and login to F5 Insight with the credentials specified in the cloud-config.yml file Configure the F5 Insight network settings using the following commands: Example: After hitting Enter, you will see the following: If no changes are needed, enter “y” to confirm. The output should look like the following: Note: Refer to the F5 Insight User Guide for further details on this procedure. Accessing the User Interface The initial configuration is complete and you can now log into the UI. You will see the Welcome screen. Click Next. Paste the text of the JWT Token and click Validate. If the license is activated, click Next. Enable the LLM Provider. Select your LLM Provider, Anthropic in this example. Enter your API Token/Key and the Enterprise API URL. Note that I am skipping TLS verification. Click Test Connection. Click Next if the test is successful On the next screen, select your preferred Setup Method. I’m using Start Fresh. Click Add Device Enter the Endpoint, Username and Password You can optionally configure a Certificate Authority and Data Center Select the Modules that are active and you want to monitor. Click Add Device. Click Next The configuration is complete. You can view the Home Page or the Device Settings. The Home Page should look like this: Conclusion F5 Insight for ADSP offers customizable visualizations and dashboards to help teams surface actionable metrics and KPIs tailored to your organization. It provides access to useful telemetry data for a deeper understanding of your environment, application behaviors, and complex BIG-IP deployments, all centralized in a single location. Identification of root causes during outages/tickets. Solve issues and struggles with Day 2 analysis of your BIG-IP Fleet and the applications therein. Mitigates the problem of a lack of detailed visual information on your BIG-IP Fleet. Set a foundation for the utilization of open-source tools and their benefits. Related Content Introducing F5 Insight for ADSP F5 Insight for ADSP - A Closer Look F5 Insight for ADSP Documentation F5 Insight Product Page F5 Insight Release Blog 605Views5likes0Comments
F5 Insight for ADSP - A Closer Look
Introduction F5 Insight for ADSP, a key component of the F5 Application Delivery and Security Platform (ADSP), helps teams monitor and secure apps that are spread across hybrid, multi-cloud and AI environments. In this article, I’ll highlight some of the key features and use cases addressed by F5 Insight. Demo Video Demo Video: F5 Insight for ADSP - A Closer Look The F5 Insight Home Screen The F5 Insight Home Screen provides comprehensive monitoring for your F5 infrastructure, applications, and security posture. It features intelligent anomaly detection and performance optimization tools, giving administrators and users a centralized view of their BIG-IP fleet health and operational status. System Report Cards The System Report Cards display health indicators ranked Good, Warning, and Critical for the following: Anomaly Detection Monitors the connection count, pool availability, CPU utilization, and memory usage. Application Performance Monitors application-level health based on response time, 4xx, and 5xx error codes. Security Monitors the expiration of SSL/TLS certificates and BIG-IP WAF events. BIG-IP Metrics Monitors for BIG-IP health issues with device resources and operational status. Fleet Status Displays a summary of all BIG-IP devices and their operational status. The Fleet Status shows all the BIG-IP devices with a status of Up, Down or Degraded. Ask AI Assistant Allows you to type queries in plain English to retrieve device statistics, configuration information, security events, device health, application performance and much more. The AI Assistant connects to a configurable Large Language Model (LLM) backend. Supported providers include OpenAI, Anthropic, or a customer provided LLM. An example query: Have there been any outages in the past 24 hours for all devices in all data centers? The AI Assistant understands the question and has identified all the data centers. The AI Assistant then checks the device statistics for any outages or issues. The AI Assistant compiles a detailed summary report of the query. Configuration of Large Language Model (LLM) Large language model (LLM) Insights bring natural language intelligence to F5 Insight, enabling you to query your BIG-IP configurations and logs conversationally. Instead of manually searching through configurations or parsing log files, you can ask questions like “Why is pool member X marked down?” or “Show me all virtual IPs (VIPs) with SSL offloading enabled” and receive immediate, contextualized, clear answers. In the toolbar on the left under Manage, select LLM Insights. Select your LLM Provider Enter your API Token/Key Enter your Enterprise API URL Click Test Connection to verify it’s working Click Save Configuration when the connection is validated. Conclusion F5 Insight for ADSP offers customizable visualizations and dashboards to help you surface metrics and KPIs tailored to your organization. It provides access to useful telemetry data for a deeper understanding of your environment, application behaviors, and complex BIG-IP deployments, all centralized in a single location. Identification of root causes during outages/tickets. Solves issues and struggles with Day 2 analysis of your BIG-IP Fleet and the applications therein. Mitigates the problem of a lack of detailed visual information on your BIG-IP Fleet. Set a foundation for the utilization of open-source tools and their benefits. Related Content Introducing F5 Insight for ADSP F5 Insight for ADSP Documentation F5 Insight Product Page 827Views5likes0Comments
Introducing F5 Insight for ADSP
Introduction F5 Insight for ADSP, a key component of the F5 Application Delivery and Security Platform (ADSP), helps teams monitor and secure apps that are spread across hybrid, multi-cloud and AI environments. In this article, I’ll highlight some of the key features and use cases addressed by F5 Insight. F5 Insight: Actionable intelligence to foster operational excellence Demo Videos Demo Video: Introduction to F5 Insight for ADSP Demo Video: F5 Insight - A Closer Look What is F5 Insight for ADSP? F5 Insight is a holistic solution that unifies every aspect of operating applications. It provides end-to-end visibility and operational narratives. It allows you to prioritize to-dos with health scores, anomaly detection, and report cards. It delivers clarity and value faster with views built by F5 experts. It provides expert guidance and optimization recommendations using natural language interactions. F5 Insight is not intended to replace SIEM solutions like Splunk or Sentinel but serves a different, complementary purpose. It’s an open-source tool designed specifically for monitoring and analyzing metrics from your BIG-IP devices. By leveraging open-source telemetry tools, it collects and presents data in a central, easy-to-read dashboard. This eliminates the need to log into individual interfaces like the CLI or GUI to sift through logs and metrics, offering streamlined visibility into your BIG-IP estate for simplified monitoring and analysis. Why is F5 Insight important? Gain out-of-the-box actionable intelligence to optimize application delivery and security: Get critical application and infrastructure performance data, operational analytics, security issues, and other telemetry in a unified tool. Surface important KPIs and data points fast by querying data using natural language with model context protocol (MCP) support. Optimize application delivery and security, as well as underlying resources, with built-in F5 expertise and guidance. Share data with F5 and use F5 AI Data Fabric for application health scores, security grades, and automatic identification and categorization of apps by type and workload (In Limited Availability) Speeds mean-time-to-innocence (MTTI) and mean-time-to-restore (MTTR) with actionable intelligence and proactive alerts. Streamlines monitoring and analysis while being able to run on its own and integrate with your existing Grafana/VictoriaMetrics stacks. Leverage data to make the business case and prove ROI for more resources, application migrations, or system refreshes. How does F5 Insight work? F5 Insight is deployed as a Virtual Machine. This gives you full access and control of your F5 BIG-IP telemetry data. The configuration is simple, log into the F5 Insight portal and add your BIG-IP devices. There is no configuration needed on BIG-IP itself. Ready to get started? Log into the F5 Insight portal: By default you will arrive at the Home screen. From the navigation menu, under Manage, click BIG-IP Settings to add your BIG-IP devices. Before we add the BIG-IP devices click the Data Centers tab and then Add Data Center. This allows you to specify a location for the BIG-IP devices. Give it a Name, San Jose, CA in this example. Click Add Data Center. Go back to the Devices tab and click Add Device. Note that you can add a single device from here or add multiple devices using the Upload YAML Files (more on this later). For now, let’s add a single device using the management address or Endpoint, Username and Password. Scroll down and specify the Certificate Authority if using custom TLS certificates on BIG-IP devices. Under Data Center select the Data Center created previously, San Jose, CA in this example. Note: if you didn’t create a Data Center you can still do it now. Under Modules select the BIG-IP Modules you are using. In this example I selected Policy Firewall (or AFM). Click Add Device. The BIG-IP from San Jose has been added. From the navigation menu select BIG-IP Device then Device Overview to see more details. Note: you can select the specific Device you want to view. Important details are shown on this screen. Some items of interest are the BIG-IP version, system model or VM, Licenses and Enabled Modules. The Home Screen displays System Report Cards and allows you to drill down into the individual widgets. System Report Cards provide at-a-glance health indicators for four critical monitoring categories. Each card displays a status badge (Good, Warning, or Critical) based on deviation thresholds. Note: you can filter the Home Screen to display a specific Data Center. Adding Multiple BIG-IPs using YAML File Upload For bulk onboarding or infrastructure-as-code workflows, import devices using YAML configuration. Using YAML streamlines bulk onboarding, ensures consistency, improves scalability, simplifies automation, and increases accuracy. It also ensures integration with IaC workflows and CI/CD pipelines—enabling reusable, version-controlled configurations. From the BIG-IP Settings screen select Add Device. Upload your Defaults and Receiver YAML files here or click Paste YAML to copy/paste them. Note: YAML import also supports configuring F5 Insight features such as high availability, LLM Insights, AIDF, and data retention policies alongside device definitions. Both BIG-IPs are now connected to F5 Insight When you return to the BIG-IP Settings screen it should look like this: A correctly configured ast-defaults.yaml file will look like the following. Note: enter the username and password to log into your BIG-IPs A correctly configured ast-receivers.yaml file will look like the following. Note: enter a Device Name and Endpoint address. Conclusion F5 Insight for ADSP offers customizable visualizations and dashboards to help teams surface actionable metrics and KPIs tailored to your organization. It provides access to useful telemetry data for a deeper understanding of your environment, application behaviors, and complex BIG-IP deployments, all centralized in a single location. Identification of root causes during outages/tickets. Solves issues and struggles with Day 2 analysis of your BIG-IP Fleet and the applications therein. Mitigates the problem of a lack of detailed visual information on your BIG-IP Fleet. Set a foundation for the utilization of open-source tools and their benefits. Related Content F5 Insight for ADSP BLOG F5 Insight Documentation F5 Insight Product Page3.2KViews4likes0CommentsDisplaying Application Study Tool (AST) Dashboards in Your Own Grafana Instance
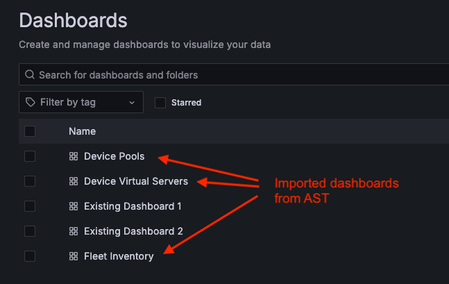
The Application Study Tool (AST) has its own Prometheus and Grafana instances. These instances run as containers and are designed to coexist with other Prometheus and Grafana instances in your environment, even on the same host. However, during demos and discussions with customers, many have expressed the desire to use their existing Grafana instance to display AST dashboards. Although it may not be obvious to new Grafana users, this process is straightforward. This blog will walk you through launching a second generic Grafana container instance, connecting it to the AST instance of Prometheus (the data source), importing a dashboard from the AST instance of Grafana, and displaying it in the new Grafana instance. If you already have a non-AST instance of Grafana running in your environment, the steps to launch a second Grafana container are optional. However, you may want to run it in order to test the import functionality and make your own customizations before importing it again into your “production” Grafana instance. Here is an example of a dashboard folder in a non-AST Grafana instance after importing three dashboards from AST: Launch a Second (Generic) Grafana Container If you already have a Grafana instance, you may skip this step. However, if you don’t, or you would like to use a “sandbox” for testing customizations before importing the dashboard into your “production“ Grafana instance, you can use the following steps to launch a new Grafana container. The following assumptions are made for the steps that follow: You are using Docker as your container runtime. (If you are using Podman, simply substitute “podman” for “docker” in each of the following commands. Other container runtimes may also work for this exercise, but I have not tested them.) You have sufficient privileges to run containers. If you don’t, you may need to run these commands with “sudo”. If that fails due to permissions errors, you will need to request the necessary privileges from your Linux administrator. We want to run Grafana version 11.5.2. Any recent version should work. However, this is the latest version as of the writing of this blog. The IP address of the host where you are running these containers is 192.168.0.15. Yours will likely be different. Use your own host’s IP when you run “curl” inside the grafana2 container. In my testing, I used MacOS. This will also work on any current Linux distribution and should work on Windows. First, launch the Grafana container. I set this new instance of Grafana to listen on port 3002 (the default for Grafana is 3000) to avoid conflicts with the AST instance, if they are running on the same host. $ docker run -d --name=grafana2 -p 3002:3000 grafana/grafana:11.5.2 Next, exec into the container to ensure it can connect to the AST instance of Prometheus. You can instead check connectivity from the Grafana UI, but the below method is a good way to troubleshoot any connectivity errors you may encounter. $ docker exec -it grafana2 bash You are now running a Bash shell inside the new Grafana container. Run a curl command to confirm the new Grafana container can reach the Prometheus application, which listens on port 9090, by default. (The IP address, 192.168.0.15, is used as an example. Use your own host's IP address here.) 5d3e8256af3d:/usr/share/grafana$ curl 192.168.0.15:9090 <a href="/graph">Found</a>. Now, it is time to test the new Grafana instance. Open a web browser and navigate to the host where this new Grafana container is running, at port 3002. If you are running on your local machine, it will be http://localhost:3002/. The default credentials are admin/admin. When first logging in, Grafana will prompt you to change the password. You may choose to change it now or click “skip” to leave it as is. Now you can export one of the dashboards from AST and import it into this instance. Export a Dashboard from AST Now that you have launched a second instance of Grafana (or you are running your own non-AST instance), it is time to import a dashboard from AST. You can import just one dashboard of your choosing (i.e., BigIP - Device Device >> Virtual Servers), or several (or even all) dashboards from AST. For this example, we will only import one dashboard, BigIP - Device Device >> Virtual Servers. If you wish to import other dashboards, the steps are the same. Navigate to the dashboard you would like to import into your Grafana instance. For the example used here, navigate to Dashboards >> BigIP – Device >> Device Virtual Servers. Click the blue "Share" button near the upper-right corner. In the pop-up box, click the Export tab. Click the blue "Save to file" button to download the JSON file representing the dashboard. Two notes: If you wish to use your own non-AST instance of Prometheus, you will need to move the slider for “Export for sharing externally” (available in the Share pop-up box, under the Export tab) to the right to enable it. This will allow you to select your own Prometheus instance as the data source when importing the dashboard into the alternate Grafana instance. The default JSON for these dashboards is also available in “dashboards” folder of the repo: https://github.com/f5devcentral/application-study-tool/tree/main/services/grafana/provisioning/dashboards. This version has the “Export for sharing externally” option enabled, so you will need to select the desired Prometheus data source – either your own or the AST instance – when importing the dashboard into the alternate Grafana instance. Import the Dashboard into the New (or Existing) Grafana Instance If you have just launched a new, generic Grafana container using the instructions in the above section, Launch a Second (Generic) Grafana Container, you can now launch the UI from a web browser by navigating to http://localhost:3002/ (assuming you are running on your local machine). The default login credentials are admin/admin. If this is just a temporary test instance, you may click “skip” when prompted to “Update your password”. (For a production instance or any instance that will be used more than just briefly, we recommend changing this to a stronger password.) If you are using an existing Grafana instance, navigate to it and log in. Connect the New Grafana Instance to the AST Prometheus Instance From this non-AST Grafana instance, verify the Prometheus data source is reachable from Grafana, and then connect to it by following these steps: In the menu bar on the left, click Connections >> Data sources. If this is a new instance of Grafana, the “Add data source” button will appear in the middle of the screen. If this is an existing instance with pre-existing data sources, the button will be in the upper-right corner of the screen and will say “Add new data source”. Click on it. Select Prometheus from the list of data sources. You may have to scroll down or enter “prometheus” in the search bar. Fill in a name (for example, “ast-prometheus”), and the URL to connect to the Prometheus instance. In my case, it was my host's private IP address, 192.168.0.15, and the port Prometheus is listening on (9090 by default): http://192.168.0.15:9090. Set the “Interval behaviour >> Scrape interval” to be the same as the value used for the collection_interval setting in your AST configuration. If you did not explicitly change it when configuring AST, it will be the default value of 60s. Click the blue "Save & test" button and ensure you get the message, “Successfully queried the Prometheus API” at the bottom of the screen. Import the Dashboard into the New Grafana Instance Click on “Dashboards” in the menu on the left. Click the blue “New” button in the upper-right and, from the drop-down, select "Import". Click on "Upload dashboard JSON file" and upload the JSON file you previously exported from the original AST dashboard. Give it a name (under Name). Under the Prometheus drop-down, select your Prometheus data source. (In the example above, it is called "ast-prometheus". If you accept the default name, it will just be “prometheus”.) Click Import. Voilà! You are now taken to the newly imported Grafana dashboard. Conclusion The Application Study Tool offers excellent observability for F5 BIG-IP systems and the traffic they handle. If you have your own Grafana instance with your own set of dashboards, there is no need to manage two separate instances. You can combine the two so you have all your dashboards in one place. The flexibility of Grafana also allows it to be highly customizable, so you can modify any of the out-of-the-box dashboards AST provides and even create your own. If you have gotten value from customizing some of the default AST dashboards, feel free to post what you did below, as many of our readers will find this valuable.2KViews10likes1Comment
APM/Analytics - Log click on webtop resources [serverside]
Problem this snippet solves: When providing VPN SSL portal to the client, you publish several applications like Portal access, Remote Desktop, Webtop links, SAML Resources, Citrix/Vmware VDI, etc. APM log access to the webtop, once connected, there is no more visibility on who click on which icon. We provide Visibility and Analytics capabilities through a simple irule. How to use this snippet: Installation You just need to put this irule in the Virtual Server configuration that handle your access profile. Logging information Clicks are logged in the local0 (ltm logs). You can see below examples : virtual=/Common/test, apm=1239853, user=testuser, resource_type=portal, resourcename=owa virtual=/Common/test, apm=1239853, user=testuser, resource_type=remote_desktop, resourcename=ActiveDirectory Features You can currently log the following application types : Portal access Remote Desktop access The irule provide the additional features : Decode Portal access uri logging of username, apm session and resource name Credits Inspired from an original irule in a reply from Kevin Stewart : Logging for Portal Access External links Github : github.com/e-XpertSolutions/f5 Code : when ACCESS_ACL_ALLOWED { switch -glob [HTTP::uri] { "*resourcetype=remote_desktop*" { # # Basic logging. Remote or local logging settings can be configured # # log local0. "virtual=[virtual], apm=[string range [ACCESS::session sid] [expr [string length [ACCESS::session sid]] - 10] end], user=[ACCESS::session data get session.logon.last.username], resourcetype=remote_desktop, [findstr [HTTP::uri] "resourcename=" 0 "\%"]" # # ACCESS logging before v13.x # log -noname accesscontrol.local1.notice "$static::ACCESS_LOG_PREFIX /Common/ap-ad-auth:Common:$session: virtual=[virtual], apm=[string range [ACCESS::session sid] [expr [string length [ACCESS::session sid]] - 10] end], user=[ACCESS::session data get session.logon.last.username], resourcetype=remote_desktop, [findstr [HTTP::uri] "resourcename=" 0 "\%"]" # # ACCESS::log is available in v13.x. Log saved in Access report too. # # ACCESS::log accesscontrol.notice "virtual=[virtual], apm=[string range [ACCESS::session sid] [expr [string length [ACCESS::session sid]] - 10] end], user=[ACCESS::session data get session.logon.last.username], resourcetype=remote_desktop, [findstr [HTTP::uri] "resourcename=" 0 "\%"]" } "*f5-w-*" { catch { set resource [binary format H* [findstr [HTTP::uri] "/f5-w-" 6 "\$\$"]] if { [table lookup -subtable PORTALACCESS "[ACCESS::session sid]:[ACCESS::session data get session.logon.last.username]:$resource"] eq "" } { table set -subtable PORTALACCESS "[ACCESS::session sid]:[ACCESS::session data get session.logon.last.username]:$resource" [clock format [clock seconds] -format %Y%m%d-%H%M%S] 3600 # # Basic logging. Remote or local logging settings can be configured # # log local0. "virtual=[virtual], apm=[string range [ACCESS::session sid] [expr [string length [ACCESS::session sid]] - 10] end], user=[ACCESS::session data get session.logon.last.username], resource_type=portal, resourcename=$resource" # # ACCESS logging before v13.x # log -noname accesscontrol.local1.notice "$static::ACCESS_LOG_PREFIX /Common/ap-ad-auth:Common:$session: virtual=[virtual], apm=[string range [ACCESS::session sid] [expr [string length [ACCESS::session sid]] - 10] end], user=[ACCESS::session data get session.logon.last.username], resource_type=portal, resourcename=$resource" # # ACCESS::log is available in v13.x. Log saved in Access report too. # # ACCESS::log accesscontrol.notice "virtual=[virtual], apm=[string range [ACCESS::session sid] [expr [string length [ACCESS::session sid]] - 10] end], user=[ACCESS::session data get session.logon.last.username], resource_type=portal, resourcename=$resource" } } } } } Tested this on version: 11.5742Views0likes4CommentsiRule Event Order
Problem this snippet solves: It's sometimes hard which event is triggered and in which order. This code provide visibility on the event order and time between each event in millisecond. Possible (but not limited to) use cases : Troubleshooting connection Identify event triggered for specific requests learn the order of irule events How to use this snippet: Installation irule You need to install the irule on the top of the list in your Virtual Server. Special considerations Irule Generator the displayed irule has been generated with a proprietary tool developed in golang. Zip file Content The downloadable zip file contains : a shell script that generate the irule code for the list of event specified in event_list.tcl file a file that contain a list of all irule event (excluded : CLIENT_ACCEPTED, CLIENT_CLOSED, RULE_INIT) an irule containing all possible events (generated by the script). Just for demo, can not be used in real life. Compatibility Supported in v12.1.0 ACCESS_PER_REQUEST_AGENT_EVENT BOTDEFENSE_ACTION BOTDEFENSE_REQUEST WS_CLIENT_DATA WS_CLIENT_FRAME WS_CLIENT_FRAME_DONE WS_REQUEST WS_RESPONSE WS_SERVER_DATA WS_SERVER_FRAME WS_SERVER_FRAME_DONE Irule Events The displayed irule currently support events from CLIENT_*, HTTP_*, LB_* and SSL_*. This irule should fit for most of the standard ltm use cases on http and https. Outputs syslog output : virtual=/Common/vs_test_irule_order_event, id=d5f693399, time=0, event_order=0, event_type=CLIENT_ACCEPTED virtual=/Common/vs_test_irule_order_event, id=d5f693399, time=0, event_order=1, event_type=CLIENTSSL_CLIENTHELLO virtual=/Common/vs_test_irule_order_event, id=d5f693399, time=6, event_order=2, event_type=CLIENTSSL_HANDSHAKE virtual=/Common/vs_test_irule_order_event, id=d5f693399, time=6, event_order=3, event_type=HTTP_REQUEST virtual=/Common/vs_test_irule_order_event, id=d5f693399, time=6, event_order=4, event_type=LB_FAILED virtual=/Common/vs_test_irule_order_event, id=d5f693399, time=6, event_order=5, event_type=CLIENT_CLOSED ` JSON output : { "d5f693399": [ { "virtual": "/Common/vs_test_irule_order_event", "id": "d5f693399", "time": "0", "event_order": "0", "event_type": "CLIENT_ACCEPTED" }, { "virtual": "/Common/vs_test_irule_order_event", "id": "d5f693399", "time": "0", "event_order": "1", "event_type": "CLIENTSSL_CLIENTHELLO" }, { "virtual": "/Common/vs_test_irule_order_event", "id": "d5f693399", "time": "6", "event_order": "2", "event_type": "CLIENTSSL_HANDSHAKE" }, { "virtual": "/Common/vs_test_irule_order_event", "id": "d5f693399", "time": "6", "event_order": "3", "event_type": "HTTP_REQUEST" }, { "virtual": "/Common/vs_test_irule_order_event", "id": "d5f693399", "time": "6", "event_order": "4", "event_type": "LB_FAILED" }, { "virtual": "/Common/vs_test_irule_order_event", "id": "d5f693399", "time": "6", "event_order": "5", "event_type": "CLIENT_CLOSED" } ] } Features Version 1.0 List Event order Generate a sessionid to track the Client connection until it close Display time elapsed since client has been accepted Logging in JSON format (to use with third party libraries like d3.js) Backlog add logging using csv format use HSL instead of local logging add extra comments for specific events like CLIENT_CERT and LB_FAILED add more events (security related events) release a script to generate an irule that use events related to the other irules present in a Virtual Server External links Github : https://github.com/e-XpertSolutions/f5 iRule Sample when RULE_INIT { set static::client_ip "192.168.10.1" set static::json 1 } when CLIENT_ACCEPTED { set counter 0 set event_type "CLIENT_ACCEPTED" set sessionid "[IP::client_addr][TCP::client_port][IP::local_addr][TCP::local_port][expr { int(100000000 * rand()) }]" binary scan [md5 $sessionid] H* md5_string trash set md5_string [string range $md5_string 12 20] set start_time [clock clicks -milliseconds] log local0. "virtual=[virtual], id=$md5_string, time=0, event_order=$counter, event_type=$event_type" if { $static::json } { set json_log "\{ \"$md5_string\": \[\{\"virtual\":\"[virtual]\", \"id\":\"$md5_string\", \"time\":\"0\", \"event_order\":\"$counter\", \"event_type\":\"$event_type\"\}," } } when CLIENT_CLOSED { set counter [expr { $counter+1 }] set event_type "CLIENT_CLOSED" set curtime [expr { [clock clicks -milliseconds] - $start_time }] log local0. "virtual=[virtual], id=$md5_string, time=$curtime, event_order=$counter, event_type=$event_type" if { $static::json } { append json_log "\{\"virtual\":\"[virtual]\", \"id\":\"$md5_string\", \"time\":\"$curtime\", \"event_order\":\"$counter\", \"event_type\":\"$event_type\"\}\]\}" log local0. "$json_log" } } when HTTP_REQUEST { set counter [expr { $counter+1 }] set event_type "HTTP_REQUEST" set curtime [expr { [clock clicks -milliseconds] - $start_time }] log local0. "virtual=[virtual], id=$md5_string, time=$curtime, event_order=$counter, event_type=$event_type" if { $static::json } { append json_log "\{\"virtual\":\"[virtual]\", \"id\":\"$md5_string\", \"time\":\"$curtime\", \"event_order\":\"$counter\", \"event_type\":\"$event_type\"\}," } } when HTTP_REQUEST_RELEASE { set counter [expr { $counter+1 }] set event_type "HTTP_REQUEST_RELEASE" set curtime [expr { [clock clicks -milliseconds] - $start_time }] log local0. "virtual=[virtual], id=$md5_string, time=$curtime, event_order=$counter, event_type=$event_type" if { $static::json } { append json_log "\{\"virtual\":\"[virtual]\", \"id\":\"$md5_string\", \"time\":\"$curtime\", \"event_order\":\"$counter\", \"event_type\":\"$event_type\"\}," } } when HTTP_RESPONSE { set counter [expr { $counter+1 }] set event_type "HTTP_RESPONSE" set curtime [expr { [clock clicks -milliseconds] - $start_time }] log local0. "virtual=[virtual], id=$md5_string, time=$curtime, event_order=$counter, event_type=$event_type" if { $static::json } { append json_log "\{\"virtual\":\"[virtual]\", \"id\":\"$md5_string\", \"time\":\"$curtime\", \"event_order\":\"$counter\", \"event_type\":\"$event_type\"\}," } } when HTTP_RESPONSE_RELEASE { set counter [expr { $counter+1 }] set event_type "HTTP_RESPONSE_RELEASE" set curtime [expr { [clock clicks -milliseconds] - $start_time }] log local0. "virtual=[virtual], id=$md5_string, time=$curtime, event_order=$counter, event_type=$event_type" if { $static::json } { append json_log "\{\"virtual\":\"[virtual]\", \"id\":\"$md5_string\", \"time\":\"$curtime\", \"event_order\":\"$counter\", \"event_type\":\"$event_type\"\}," } } when HTTP_RESPONSE_CONTINUE { set counter [expr { $counter+1 }] set event_type "HTTP_RESPONSE_CONTINUE" set curtime [expr { [clock clicks -milliseconds] - $start_time }] log local0. "virtual=[virtual], id=$md5_string, time=$curtime, event_order=$counter, event_type=$event_type" if { $static::json } { append json_log "\{\"virtual\":\"[virtual]\", \"id\":\"$md5_string\", \"time\":\"$curtime\", \"event_order\":\"$counter\", \"event_type\":\"$event_type\"\}," } } when HTTP_REQUEST_SEND { set counter [expr { $counter+1 }] set event_type "HTTP_REQUEST_SEND" set curtime [expr { [clock clicks -milliseconds] - $start_time }] log local0. "virtual=[virtual], id=$md5_string, time=$curtime, event_order=$counter, event_type=$event_type" if { $static::json } { append json_log "\{\"virtual\":\"[virtual]\", \"id\":\"$md5_string\", \"time\":\"$curtime\", \"event_order\":\"$counter\", \"event_type\":\"$event_type\"\}," } } when HTTP_REQUEST_DATA { set counter [expr { $counter+1 }] set event_type "HTTP_REQUEST_DATA" set curtime [expr { [clock clicks -milliseconds] - $start_time }] log local0. "virtual=[virtual], id=$md5_string, time=$curtime, event_order=$counter, event_type=$event_type" if { $static::json } { append json_log "\{\"virtual\":\"[virtual]\", \"id\":\"$md5_string\", \"time\":\"$curtime\", \"event_order\":\"$counter\", \"event_type\":\"$event_type\"\}," } } when CLIENT_DATA { set counter [expr { $counter+1 }] set event_type "CLIENT_DATA" set curtime [expr { [clock clicks -milliseconds] - $start_time }] log local0. "virtual=[virtual], id=$md5_string, time=$curtime, event_order=$counter, event_type=$event_type" if { $static::json } { append json_log "\{\"virtual\":\"[virtual]\", \"id\":\"$md5_string\", \"time\":\"$curtime\", \"event_order\":\"$counter\", \"event_type\":\"$event_type\"\}," } } when HTTP_PROXY_REQUEST { set counter [expr { $counter+1 }] set event_type "HTTP_PROXY_REQUEST" set curtime [expr { [clock clicks -milliseconds] - $start_time }] log local0. "virtual=[virtual], id=$md5_string, time=$curtime, event_order=$counter, event_type=$event_type" if { $static::json } { append json_log "\{\"virtual\":\"[virtual]\", \"id\":\"$md5_string\", \"time\":\"$curtime\", \"event_order\":\"$counter\", \"event_type\":\"$event_type\"\}," } } when HTTP_DISABLED { set counter [expr { $counter+1 }] set event_type "HTTP_DISABLED" set curtime [expr { [clock clicks -milliseconds] - $start_time }] log local0. "virtual=[virtual], id=$md5_string, time=$curtime, event_order=$counter, event_type=$event_type" if { $static::json } { append json_log "\{\"virtual\":\"[virtual]\", \"id\":\"$md5_string\", \"time\":\"$curtime\", \"event_order\":\"$counter\", \"event_type\":\"$event_type\"\}," } } when SERVER_CLOSED { set counter [expr { $counter+1 }] set event_type "SERVER_CLOSED" set curtime [expr { [clock clicks -milliseconds] - $start_time }] log local0. "virtual=[virtual], id=$md5_string, time=$curtime, event_order=$counter, event_type=$event_type" if { $static::json } { append json_log "\{\"virtual\":\"[virtual]\", \"id\":\"$md5_string\", \"time\":\"$curtime\", \"event_order\":\"$counter\", \"event_type\":\"$event_type\"\}," } } when SERVER_DATA { set counter [expr { $counter+1 }] set event_type "SERVER_DATA" set curtime [expr { [clock clicks -milliseconds] - $start_time }] log local0. "virtual=[virtual], id=$md5_string, time=$curtime, event_order=$counter, event_type=$event_type" if { $static::json } { append json_log "\{\"virtual\":\"[virtual]\", \"id\":\"$md5_string\", \"time\":\"$curtime\", \"event_order\":\"$counter\", \"event_type\":\"$event_type\"\}," } } when SERVERSSL_DATA { set counter [expr { $counter+1 }] set event_type "SERVERSSL_DATA" set curtime [expr { [clock clicks -milliseconds] - $start_time }] log local0. "virtual=[virtual], id=$md5_string, time=$curtime, event_order=$counter, event_type=$event_type" if { $static::json } { append json_log "\{\"virtual\":\"[virtual]\", \"id\":\"$md5_string\", \"time\":\"$curtime\", \"event_order\":\"$counter\", \"event_type\":\"$event_type\"\}," } } when SERVER_CONNECTED { set counter [expr { $counter+1 }] set event_type "SERVER_CONNECTED" set curtime [expr { [clock clicks -milliseconds] - $start_time }] log local0. "virtual=[virtual], id=$md5_string, time=$curtime, event_order=$counter, event_type=$event_type" if { $static::json } { append json_log "\{\"virtual\":\"[virtual]\", \"id\":\"$md5_string\", \"time\":\"$curtime\", \"event_order\":\"$counter\", \"event_type\":\"$event_type\"\}," } } when CLIENTSSL_DATA { set counter [expr { $counter+1 }] set event_type "CLIENTSSL_DATA" set curtime [expr { [clock clicks -milliseconds] - $start_time }] log local0. "virtual=[virtual], id=$md5_string, time=$curtime, event_order=$counter, event_type=$event_type" if { $static::json } { append json_log "\{\"virtual\":\"[virtual]\", \"id\":\"$md5_string\", \"time\":\"$curtime\", \"event_order\":\"$counter\", \"event_type\":\"$event_type\"\}," } } when CLIENTSSL_CLIENTCERT { set counter [expr { $counter+1 }] set event_type "CLIENTSSL_CLIENTCERT" set curtime [expr { [clock clicks -milliseconds] - $start_time }] log local0. "virtual=[virtual], id=$md5_string, time=$curtime, event_order=$counter, event_type=$event_type" if { $static::json } { append json_log "\{\"virtual\":\"[virtual]\", \"id\":\"$md5_string\", \"time\":\"$curtime\", \"event_order\":\"$counter\", \"event_type\":\"$event_type\"\}," } } when CLIENTSSL_CLIENTHELLO { set counter [expr { $counter+1 }] set event_type "CLIENTSSL_CLIENTHELLO" set curtime [expr { [clock clicks -milliseconds] - $start_time }] log local0. "virtual=[virtual], id=$md5_string, time=$curtime, event_order=$counter, event_type=$event_type" if { $static::json } { append json_log "\{\"virtual\":\"[virtual]\", \"id\":\"$md5_string\", \"time\":\"$curtime\", \"event_order\":\"$counter\", \"event_type\":\"$event_type\"\}," } } when CLIENTSSL_HANDSHAKE { set counter [expr { $counter+1 }] set event_type "CLIENTSSL_HANDSHAKE" set curtime [expr { [clock clicks -milliseconds] - $start_time }] log local0. "virtual=[virtual], id=$md5_string, time=$curtime, event_order=$counter, event_type=$event_type" if { $static::json } { append json_log "\{\"virtual\":\"[virtual]\", \"id\":\"$md5_string\", \"time\":\"$curtime\", \"event_order\":\"$counter\", \"event_type\":\"$event_type\"\}," } } when CLIENTSSL_SERVERHELLO_SEND { set counter [expr { $counter+1 }] set event_type "CLIENTSSL_SERVERHELLO_SEND" set curtime [expr { [clock clicks -milliseconds] - $start_time }] log local0. "virtual=[virtual], id=$md5_string, time=$curtime, event_order=$counter, event_type=$event_type" if { $static::json } { append json_log "\{\"virtual\":\"[virtual]\", \"id\":\"$md5_string\", \"time\":\"$curtime\", \"event_order\":\"$counter\", \"event_type\":\"$event_type\"\}," } } when SERVERSSL_CLIENTHELLO_SEND { set counter [expr { $counter+1 }] set event_type "SERVERSSL_CLIENTHELLO_SEND" set curtime [expr { [clock clicks -milliseconds] - $start_time }] log local0. "virtual=[virtual], id=$md5_string, time=$curtime, event_order=$counter, event_type=$event_type" if { $static::json } { append json_log "\{\"virtual\":\"[virtual]\", \"id\":\"$md5_string\", \"time\":\"$curtime\", \"event_order\":\"$counter\", \"event_type\":\"$event_type\"\}," } } when SERVERSSL_HANDSHAKE { set counter [expr { $counter+1 }] set event_type "SERVERSSL_HANDSHAKE" set curtime [expr { [clock clicks -milliseconds] - $start_time }] log local0. "virtual=[virtual], id=$md5_string, time=$curtime, event_order=$counter, event_type=$event_type" if { $static::json } { append json_log "\{\"virtual\":\"[virtual]\", \"id\":\"$md5_string\", \"time\":\"$curtime\", \"event_order\":\"$counter\", \"event_type\":\"$event_type\"\}," } } when SERVERSSL_SERVERHELLO { set counter [expr { $counter+1 }] set event_type "SERVERSSL_SERVERHELLO" set curtime [expr { [clock clicks -milliseconds] - $start_time }] log local0. "virtual=[virtual], id=$md5_string, time=$curtime, event_order=$counter, event_type=$event_type" if { $static::json } { append json_log "\{\"virtual\":\"[virtual]\", \"id\":\"$md5_string\", \"time\":\"$curtime\", \"event_order\":\"$counter\", \"event_type\":\"$event_type\"\}," } } when LB_QUEUED { set counter [expr { $counter+1 }] set event_type "LB_QUEUED" set curtime [expr { [clock clicks -milliseconds] - $start_time }] log local0. "virtual=[virtual], id=$md5_string, time=$curtime, event_order=$counter, event_type=$event_type" if { $static::json } { append json_log "\{\"virtual\":\"[virtual]\", \"id\":\"$md5_string\", \"time\":\"$curtime\", \"event_order\":\"$counter\", \"event_type\":\"$event_type\"\}," } } when LB_FAILED { set counter [expr { $counter+1 }] set event_type "LB_FAILED" set curtime [expr { [clock clicks -milliseconds] - $start_time }] log local0. "virtual=[virtual], id=$md5_string, time=$curtime, event_order=$counter, event_type=$event_type" if { $static::json } { append json_log "\{\"virtual\":\"[virtual]\", \"id\":\"$md5_string\", \"time\":\"$curtime\", \"event_order\":\"$counter\", \"event_type\":\"$event_type\"\}," } } when LB_SELECTED { set counter [expr { $counter+1 }] set event_type "LB_SELECTED" set curtime [expr { [clock clicks -milliseconds] - $start_time }] log local0. "virtual=[virtual], id=$md5_string, time=$curtime, event_order=$counter, event_type=$event_type" if { $static::json } { append json_log "\{\"virtual\":\"[virtual]\", \"id\":\"$md5_string\", \"time\":\"$curtime\", \"event_order\":\"$counter\", \"event_type\":\"$event_type\"\}," } } Code : 68686 Tested this on version: 11.51.8KViews0likes3Comments
High-level Pathways to Security Visibility
Editor's Note: The F5 Beacon capabilities referenced in this article hosted on F5 Cloud Services are planning a migration to a new SaaS Platform - Check out the latest here. (10 Minute Read) Introduction In previous articles we identified the elements needed to gain visibility into adaptive application security postures. This entails observing the security configuration (static) and monitoring telemetry (dynamic) coming from different control points (ref. Visibility and Orchestration). We also suggested that security visibility should be integrated in the software development and/or deployment lifecycle as part of a shift-left strategy (ref. Shift-left Security Visibility). Now, we’ll focus on identifying a high-level pathway to achieve application security visibility. First, we need to identify the constraints that frame the effort. We will then identify concrete examples of insertion with F5 technologies. The end-goal is to ensure that you keep close control over the application security by embracing a holistic approach to visibility integrated in the software development/deployment lifecycle. Constraints Inserting security visibility in your enterprise is part of the shift-left strategy (ref. url-to-shift-left-sec-vis.). (https://www.f5.com/company/blog/beyond-visibility-is-operability) In order to be practical, we need to make sure that the pathway adheres to the following guidelines: Friction – The solution should not introduce any friction into the pipeline - For example, the tools used by the DEVOPS and SECOPS teams (e.g. Gitlab, Jenkins) should be the same avoiding gated interdependencies where a change by one group is blocked/delayed by the other. Programmability – The security-centric solutions implemented during the journey need to be highly programmable – This will ensure that the tools adapt to the environment (e.g. services, micro-services), the supporting infrastructure (e.g. cloud, containers), and the application. Automation – Enabling automation is key. This can be achieved by ensuring the tools deployed can be automatically configured without intervention as part of a pipeline. One way to ensure this is to leverage declarative application programing interfaces (API) (link-to-f5-declarative-interface) Scalability – Applications can span across infrastructure that is infinitely scalable like public cloud, across availability zones and geographies. This requires that any solution that is deployed to secure/protect applications and workloads be able to scale. To scale horizontally, the solution can be implemented across multiple workloads in multiple instances. To scale vertically, the solution should be able to handle increasing amounts of traffic in single/few instances. Transparency – From a performance and functionality standpoint, the solutions inserted to gain security visibility cannot impact the application. For example, when a proxy is inserted, it cannot add latency between the client and the workload. It also cannot affect the functionality provided by the workload. Resiliency – Inserting a solution to support your applications security and visibility should be resilient. Any failure of the process providing visibility should be flagged and not affect the application’s/workload’s performance or availability. Visibility Insertion All F5 solutions can be inserted in the application delivery infrastructure to provide security visibility. This comes in the form security-aware proxies. The BIG-IP or NGINX Plus platforms are particularly well-suited for insertion in infrastructure requiring inline low-latency and powerful application security and visibility. Deploying F5 solutions can easily be done observing all the constraints mentioned above. Friction Thanks to the available form factors and programmatic templates provided, implementing BIG-IP or NGINX Plus in the infrastructure is easily achieved using appropriate templates. For example, when working with AWS, a BIG-IP can easily be deployed using a Cloud Formation Template (CFT) found here. From the enterprise git (Gitlab, Github, Bitbucket etc.) repository, BIG-IP can be deployed directly by cloning/forking the F5 repository and integrating with the pipeline (ref. Clouddocs Article). Programmability The BIG-IP Advanced Web Application Firewall (Advanced WAF) configuration is highly programable. The advantage is that the configuration can be stored and or modified easily outside of the BIG-IP. For example, an base policy aimed at protecting against OWASP Top 10 Risks can look like the following: { "policy": { "name": "Complete_OWASP_Top_Ten", "description": "A generic, OWASP Top 10 protection items v1.0", "template": { "name": "POLICY_TEMPLATE_RAPID_DEPLOYMENT" }, "fullPath": "/Common/Complete_OWASP_Top_Ten", "enforcementMode":"transparent", "signature-settings":{ "signatureStaging": false, "minimumAccuracyForAutoAddedSignatures": "high" }, "protocolIndependent": true, "caseInsensitive": true, "general": { "trustXff": true }, "data-guard": { "enabled": true }, "policy-builder-server-technologies": { "enableServerTechnologiesDetection": true }, "blocking-settings": { "violations": [ { "alarm": true, "block": true, "description": "ASM Cookie Hijacking", "learn": false, "name": "VIOL_ASM_COOKIE_HIJACKING" }, { "alarm": true, "block": true, "description": "Access from disallowed User/Session/IP/Device ID", "name": "VIOL_SESSION_AWARENESS" }, { "alarm": true, "block": true, "description": "Modified ASM cookie", "learn": true, "name": "VIOL_ASM_COOKIE_MODIFIED" }, { "alarm": true, "block": true, "description": "XML data does not comply with format settings", "learn": true, "name": "VIOL_XML_FORMAT" }, { "name": "VIOL_FILETYPE", "alarm": true, "block": true, "learn": true } ], "evasions": [ { "description": "Bad unescape", "enabled": true, "learn": true }, { "description": "Apache whitespace", "enabled": true, "learn": true }, { "description": "Bare byte decoding", "enabled": true, "learn": true }, { "description": "IIS Unicode codepoints", "enabled": true, "learn": true }, { "description": "IIS backslashes", "enabled": true, "learn": true }, { "description": "%u decoding", "enabled": true, "learn": true }, { "description": "Multiple decoding", "enabled": true, "learn": true, "maxDecodingPasses": 3 }, { "description": "Directory traversals", "enabled": true, "learn": true } ] }, "xml-profiles": [ { "name": "Default", "defenseAttributes": { "allowDTDs": false, "allowExternalReferences": false } } ], "session-tracking": { "sessionTrackingConfiguration": { "enableTrackingSessionHijackingByDeviceId": true } } } } In the example above, aspects of a security policy like evasion techniques, or cookie consumption settings can easily be programmed in the configuration and handled like any other application code for versioning, editing or storing. The standard JSON format can be managed in a Git repository for use in any environment. Documentation for JSON representations of WAF policies can be found here. This is also true for all F5 security platforms including NGINX App Protect or Essential App Protect (ref. NGINX Configuration Guide and EAP API Users Guide). Similarly, configuring BIG-IP to forward security information telemetry to appropriate facilities can be achieved with the use of the Telemetry Streaming framework. For example, in order to configure BIG-IP to send telemetry data to a centralized visibility tool (F5 Beacon, or ELK for example) it can be configured with a declaration like: "class": "Telemetry", "controls": { "class": "Controls", "logLevel": "debug" }, "TS_Poller": { "class": "Telemetry_System_Poller", "interval": 60 }, "TS_Listener": { "class": "Telemetry_Listener", "port": 6514 }, "TS_Consumer": { "class": "Telemetry_Consumer", "type": "Generic_HTTP", "host": "my.visibility-host.url", "protocol": "http", "port": 8888, "path": "/", "method": "POST", "headers": [ { "name": "content-type", "value": "application/json" } ] } } The above declaration identifies the host where it will send telemetry – in this case debug data Scalability, Transparency and Resiliency F5 provides highly scalable, resilient and transparent solutions that can be inserted in any infrastructure to secure and provide visibility into web applications. Discussing these aspects of BIG-IP, NGINX Plus, or NGINX App Protect is beyond the scope of this article. For more information on scalability and high-availability you can refer to Performance of NGINX and NGINX Plus, NGINX App Protect Application Security Testing or BIG-IP Datasheet. Conclusion This article is meant to offer a path to visibility using F5 technology by inserting BIG-IP and configure it to provide application security and generate telemetry to gain visibility into the application's security posture. The aim is for you build a blueprint to systematically watch over your adaptive valuable applications and workloads across your infrastructure.535Views0likes0CommentsShift-left Security Visibility
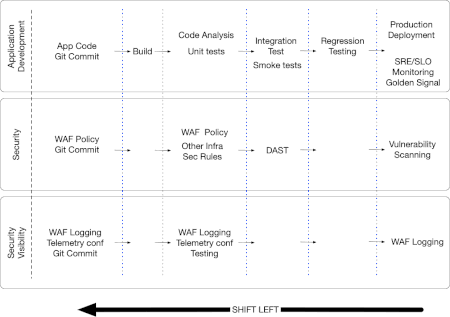
5 Minute Read Applications evolve rapidly whether your organization runs off-the-shelf applications or builds its own applications and frameworks. Increasingly, workloads are developed in a matter of hours, packaged, instantiated and torn down in timespans measured in minutes. This is the nature of continuous deployment pipelines. Securing applications and workloads that are highly dynamic possibly living across different colocation facilities (Colos) and cloud infrastructures (public and private), can only be achieved following continuous integration and continuous deployment (CI/CD) methodologies. In practice, this has resulted in integrating security in the software development and deployment lifecycles with the automation of: · Code scanning when checked in to software versioning management tools (Git repository) using static application security testing (SAST), · Integrating web application firewall (WAF) in the CI/CD pipeline as can be seen with BIG-IP Advanced WAF or NGINX App Protect and Kubernetes · Verifying artifacts used for application instantiation such as packages and containers during creation, before they are stored to ensure that they are free of malware · Scanning applications/workloads at runtime as part of the pipeline before deployment in production leveraging dynamic application security testing (DAST) tools · Securing runtime environments enforcing admission control, use of least-privilege during spin-up, and implementing monitoring · Building in compliance at every stage of the development and deployment process as needed (HIPAA, PCI etc.) Building automated and orchestrated · Monitoring Kubernetes clusters and other cloud and physical infrastructure where workloads run, however ephemerally, tracking things like container health, container orchestration and ownership across the cluster · Monitoring workloads and cloud services following site reliability engineering (SRE) guidelines – following the “Golden Signals” (Source: SRE Book) · Performing regular vulnerability scanning of applications in production Building security in the early stages of the software development lifecycle is part of a “shift-left” strategy, and is discussed here or here. In order to support specific service level objectives (SLO), monitoring at the application and infrastructure level is built into the infrastructure from the perspective of latency, traffic, errors and saturation. More information on adopting SRE with F5 can be found here. What about security visibility? The fundamental need to have a holistic view of the application and its components is essential to be able to mitigate threats. You need to visualize your applications and possible threats in order to assess risk, identify threat vectors before attackers do, and possibly investigate in the event of an issue. In a previous article, we focused on the posture assessment (static view) and monitoring (dynamic view) axis as fundamentals of security visibility. Implementing this visibility entails building and deploying security and security visibility within the pipeline along-side the application, workload or infrastructure. The above figure shows the insertion of WAF policy and logging the software building pipeline. In a shift-left effort the logging, telemetry and security policy configuration is integrated alongside the application’s SDLC. The intent is to leverage the same pipeline infrastructure and have the security and visibility aspects integrated in the project with the workload code. WAF only provides one aspect of the application security suite and is the focus of this exercise. Other infrastructure-centric security configurations, such as mTLS use within a Kubernetes Service Mesh or authentication/authorization framework configurations, can also be inserted in the pipeline. In order to simplify testing and deployment, the security infrastructure needs to be defined as code for consistent deployment for testing and production environments. Within an infrastructure-as-code and security-as-code framework, this article is meant to outline the need for visibility-as-code, and more precisely security-visibility-as-code. All F5 WAF products and their associated logging, monitoring and telemetry capabilities are easily automated and defined as-code. They can be inserted anywhere programmatically in all environment for testing as well as production.1KViews0likes0CommentsDeploying a web application firewall policy with central learning from BIG-IQ
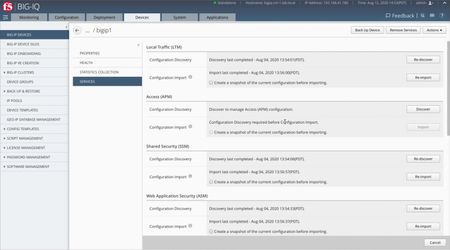
Scope This article is useful for BIG-IP/BIG-IQ users familiar with web application security. This includes, application security professionals, infrastructure management operators. Introduction Centralized Policy Building (CPB) is a feature specific to BIG-IQ. It allows security administrators to create, deploy and manage web application firewall (WAF) policies on BIG-IP devices. The policy building can occur manually or automatically. This feature is comparable to the on-box policy building feature available on BIG-IP and is better suited for distributed environments. This article focuses on the configuration of the central learning feature for web application security policies in BIG-IQ. It will take you through the different steps to create, deploy and manage the WAF policy, as well as the appropriate logging profile. The virtual server and other related elements such as profiles, pools etc. are configured using the Applications framework leveraging AS3. The steps are documented for the operator to use the BIG-IQ web user interface (webUI) to manage the WAF policy. The creation of the virtual server object can be done directly from the BIG-IQ webUI or through a simple REST call (leveraging the Postman™ client https://www.postman.com/product/api-client/). Pre-requisites The following pre-requisites must be met in order to follow the procedures outlined below: BIG-IQ Central Management (CM) and BIG-IQ Data Collection Device (DCD) are deployed provisioned with all appropriate licensing. BIG-IP is deployed licensed and provisioned with both the ASM and AVR modules. A web application is available for securing via BIG-IP. All networking and network security must be in place to allow traffic between the different components. The BIG-IP, BIG-IQ CM, BIG-IQ DCD, application servers etc. all must be reachable as described here. The BIG-IP is running TMOS version 14.1 or greater. The BIG-IQ is running version 7.0 or greater. The discovery and import process for the target BIG-IP is completed as documented here. The administrator/operator performing the procedure below will have admin-level access to the BIG-IQ CM webUI. BIG-IQ AS3 Templates are loaded on the BIG-IQ CM as described here. Overview The procedure detailed below goes over the following main steps on BIG-IQ: Verify proper BIG-IP/BIG-IQ configuration and reachability Create a web application security (the sample policy used in this example is created with central policy building enabled for manual learning and manual deployment of policy changes to the BIG-IP) Create a logging profile for application security Deploy the policy and logging profile using the “inactive” inactive virtual server and the profile pinning mechanism Create the application definition using AS3 referencing the policy and logging profile in the declaration. Send test traffic to the virtual server Review logs and learning suggestions on BIG-IQ Procedure For the following steps it is assumed that the operator is logged in the BIG-IQ CM webUI and has the necessary administrative rights to create, update and delete web application security configuration as well as create applications. BIG-IQ accommodates fine-grained role-based access control (RBAC) to assign different roles to different user, e.g. security administrator role for policy management, and application administrator for other aspects of the configuration. This is beyond the scope of this article, more information is available here. BIG-IQ/BIG-IP configuration From the Devices tab, click on BIG-IP DEVICES and select the target BIG-IP (in this case bigip1) and verify that the following SERVICES are discovered and imported: Local Traffic (LTM) Shared Security (SSM) Web Application Security (ASM) Ensure that the BIG-IQ DCD nodes Web Application Security service is enabled (System >> BIG-IQ DATA COLLECTION >> BIG-IQ Data Collection Devices >> [name of DCD device] >> SERVICES): WAF Policy Creation From the Configuration tab, expand SECURITY and Web Application Security Click on Policies and the Create button Fill out the Name field – and configure the policy features as desired (the picture below provides a sample for illustration purposes only and is not to be used in your environment) Click on the Save button located at the bottom right of the screen In the policy configuration window, expand POLICY BUILDING, and select Settings From the Policy Building Mode select Central from the drop down Select the Policy Building Device (the BIG-IQ DCD configured previously with the BIG-IQ CM) Finish configuring other dimensions in the policy as needed and click on the Save & Close button located at the bottom right of the window. Logging Profile Creation In the Configuration tab, expand the SECURITY and Shared Security sections and click on Logging Profiles Click on the Create button Enter a Name in the appropriate field and click on Save at the bottom right of the screen Click on APPLICATION SECURITY Disable Local Storage for the profile Check the Remote Storage, enter the IP address of the BIG-IQ DCD in the Protocol portion of the configuration screen, as shown in the sample below. Click on the Add button in the Server Addresses dialog, and then select Save & Close on the bottom right of the screen WAF Policy and Logging Profile Deployment Deploy the policy to the BIG-IP using the inactive virtual server Add the policy to the virtual server on the appropriate BIG-IP Click on Save & Close From the Configuration >> Security >> Web Application Security >> Virtual Servers window select the ‘inactive’ virtual server for the target BIG-IP and click on Deploy as shown below: Follow the deployment screen instructions: Name the deployment (e.g deploy_demo_policy) Select deployment method (e.g. deploy immediately) Select a target device (e.g. the BIG-IP where the policy is deployed) Click on Deploy Pin the logging profile to the BIG-IP (you can also choose to create the logging profile Navigate to Configuration >> SECURITY >> Shared Security >> Pinning Policies Click on the target BIG-IP(s) and add the logging profile by selecting Logging Profiles from the drop down as shown below: Select the logging profile from the list and click on “Add Selected” Click on Save & Close Navigate to Configuration >> Shared Security >> Logging Profiles Select the logging profile that was just pinned and click on Deploy Complete the deployment process as discussed above. You are now ready to deploy the application using AS3. Application Creation (AS3) Go to the Applications tab Click on Create Select the appropriate AS3 Template (in the example below this is a template labelled AS3-F5-HTTPS-WAF-existing-template-big-iq-defult-v1 – for more information on using AS3 with BIG-IQ, more information can be found here) Fill out the required fields including: Application Name (e.g. demo_app) Application Service Name (e.g. demo_app_service) Target (BIG-IP device) Tenant Pool Members (IP & Port) policyWAF (e.g. /Common/demo_policy) Virtual Addresses (VS address) Security Log Profiles (e.g. /Common/demo_log_profile) All the needed Analytics Profile entities required Click on Create Ensure that the Application Service was created, it should look something like: You are now able to send test traffic to the application. Feel free to use the f5-waf-tester tool available here. Log and Suggestions Review Now that the traffic is going to the application and, let's take a look at what BIG-IQ provides in terms of visibility. Go to Monitoring, expand DASHBOARDS, select L7 Security: Select the protected virtual server and select Event Logs in the View in … drop-down and you should be able to view the application security logs: To look at the suggestions resulting from the traffic being sent to the BIG-IP, go to Configuration >> SECURITY >> Web Application Security >> Policies Click on the target policy – and select POLICY BUILDING >>Suggestions: Select the suggestions you wish to accept, ignore, or delete, and click on the appropriate action button (e.g. Accept) Confirm your choice as appropriate on the pop-up window as needed. Once all the suggestions have been accepted, deploy the policy to the relevant BIG-IP(s) as needed: Deployment >> EVALUATE & DEPLOY >> Web Application Security and click on Create Follow the instructions to complete the deployment process. Conclusion BIG-IQ provides the ideal platform to enable security operations independently from the devops group. The multiple personas can run their tasks independently and effectively gaining granular visibility in the application performance, security, and overall status. Please note that the above steps are also used in an F5 CloudDocs Lab available by following this link.1.6KViews0likes0Comments