statistics
19 TopicsRewrite profile statistics in ltm
Hi, I have some rewrite profiles attatched to LTM virtual servers. I don´t know if they are being used and I would like to delete them if they are not being used. Is there a way to let me know if these profiles are being matched? Thank you very much.684Views0likes3CommentsGTM - Lingo translated from an LTM perspective (and monitoring)
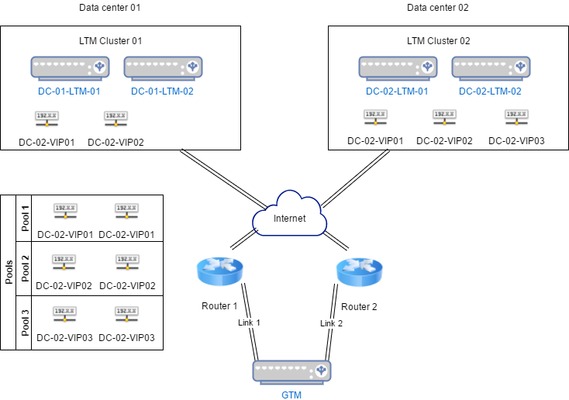
Dear experts I've set out to find typically good stuff to monitor on the GTM and to do that I had to re-evaluate some terms and things I took for granted from the LTM world. I thought I'd share what I have written down. Hopefully it will help some other poor soul coming from the LTM side to get the grip of the basics. Please do comment if (or actually rather when) I've misunderstood something? A diagram of a basic set-up Lingo Server This is the equivalent of an F5 unit (or a generic server). Data center This is more or less just a container with Servers in them. Data center availability is determined by doing an aggregate checks of virtual server statuses. If all virtual servers are down, the data-center is down, otherwise not. Virtual server These are the classical virtual servers we know from the LTM. Wide IP This is the actual dns record and it's aliases. The wide IP uses a pool containing one or more LTM virtual servers (or, a manually defined fallback server IP). The GTM uses the pool to select the best server based on criteria defined by the admin (GEO-IP based, connections, just plain round-robin, irules etc.). Link A link is a possible path to the internet. In case a GTM is connected to multiple routers it can also use multiple links in case one, or more of the routers is unavailable. If all links are down, the objects monitored via those links also goes down. If no link is specified the GTM would use the configured routing. Listeners This is where the clients would send their DNS queries. You must have at least one in order for GTM to work, but more than one is also possible. Monitoring of virtual servers The GTM would not monitor F5 devices like the LTM monitors its pool members and nodes. Instead it establishes a trust with the devices by running the bigip_add (a bit like device trust) and then the monitoring is done through iQuery. Monitoring In order to get a basic monitoring going I've thought out the following parts. Please let me know if something should be added? Availability: Server availability Data center availability Virtual server availablity Wide IP availability* Link availability Status of iQuery Statistics: Memory, CPU, throughput etc Requests per Wide IP Unhandled requests per Wide IP Total requests per GTM Total unhandled requests per GTM Any comments/feedback very much appreciated!449Views0likes4CommentsShow iRule SNAT Statistics
I have a number of LTM wildcard Virtual Servers defined which have iRules applied that NAT the source address. Here is an example of an iRule: text when CLIENT_ACCEPTED { snat 1.1.1.1 } text I am seeing intermittent dropped connections and I am trying to determine if I am exhausting the ephemeral ports. I have tried running 'tmsh show ltm snat detail', but that only appears to display the statistics for defined SNATs and not SNAT functions generated from an iRule. Is there a way to show the statistics for a SNAT that is defined in an iRule, but not defined in the SNAT list?243Views0likes2CommentsGet system compression statistics from command line?
Hi! Does anyone know a way of getting system wide compression throughput from the command line? I need to get certain metrics limited by licenses, but have only found SSL TPS and throughput via tmsh, not compression. Tmsh and bash is what I'm allowed to use and I can't use SNMP as it has to be compatible with all systems, even those with SNMP disabled (doing this for a client with very specific needs and methods). Example: show sys performance all-stats Sys::Performance System ------------------------------------------------------------------- System CPU Usage(%) Current Average Max(since 11/06/16 12:37:17) ------------------------------------------------------------------- Utilization 28 28 43 ------------------------------------------------------------------- Memory Used(%) Current Average Max(since 11/06/16 12:37:17) ------------------------------------------------------------------- TMM Memory Used 11 11 11 Other Memory Used 63 63 63 Swap Used 0 0 0 Sys::Performance Connections --------------------------------------------------------------------------- Active Connections Current Average Max(since 11/06/16 12:37:17) --------------------------------------------------------------------------- Connections 45.1K 43.2K 49.4K --------------------------------------------------------------------------- Total New Connections(/sec) Current Average Max(since 11/06/16 12:37:17) --------------------------------------------------------------------------- Client Connections 916 962 1.1K Server Connections 745 782 922 --------------------------------------------------------------------------- HTTP Requests(/sec) Current Average Max(since 11/06/16 12:37:17) --------------------------------------------------------------------------- HTTP Requests 2.8K 2.8K 3.3K Sys::Performance Throughput ----------------------------------------------------------------------------- Throughput(bits)(bits/sec) Current Average Max(since 11/06/16 12:37:17) ----------------------------------------------------------------------------- Service 644.2M 622.5M 807.2M In 659.1M 638.1M 828.2M Out 303.5M 300.6M 375.6M ----------------------------------------------------------------------------- SSL Transactions Current Average Max(since 11/06/16 12:37:17) ----------------------------------------------------------------------------- SSL TPS 599 640 790 ----------------------------------------------------------------------------- Throughput(packets)(pkts/sec) Current Average Max(since 11/06/16 12:37:17) ----------------------------------------------------------------------------- Service 78.7K 77.1K 97.6K In 78.5K 77.1K 97.8K Out 68.4K 67.8K 84.1K Sys::Performance Ramcache ------------------------------------------------------------------------ RAM Cache Utilization(%) Current Average Max(since 11/06/16 12:37:17) ------------------------------------------------------------------------ Hit Rate 61 63 70 Byte Rate 67 67 75 Eviction Rate 8 14 28 Any input appreciated! /Patrik306Views0likes1CommentBIG-IQ statistics in dashboard missing/interrupted
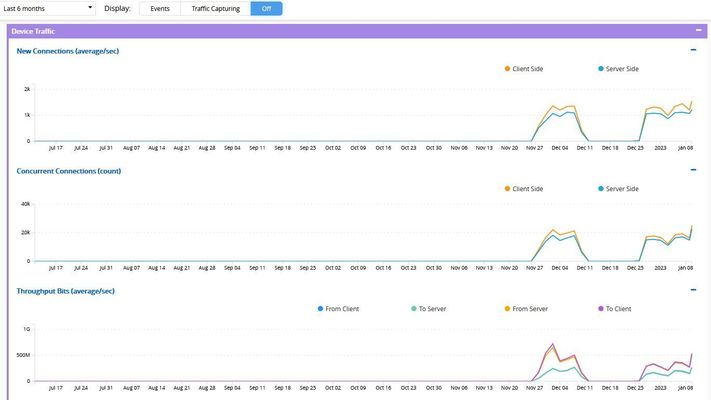
Dear all, any idea, why statistics data is missing/interrupted for a few days like in the following screenshot? Or how I can verify any issues? In which logs can I found any hints? The missing data is visible for device statistics as well as for Local Traffic. Am I right, that these statistics are the ones, which are stored on the DCDs? And why is there no data before 27.11.2022? Is there any limit configured that just the last 30 days (or so) will be stored? Does this indicate to an connectivity issue between the DCDs and the BIG-IPs? As of now I could only verify that the ucs backups were successfully executed during these days, so connectivity between the BIG-IQ and the BIG-IPs was fine? Thanks for any useful ideas or hints. Regards Stefan 🙂Solved1.6KViews0likes7CommentsNew Connections - missing statistics
Hello, I am wondering why there is no data for new connections in the analytics screen Statistics ›› Analytics : Virtual Servers : TCP : Connections I can see avg active and concurrent connections (Traffic Details:Connections) just fine, but I am interested in the connection attempts per second and not the avg active. Is there any logging profile that needs to be activated for that? Running v16736Views0likes2CommentsAnalytics : HTTP : Transactions - Export Top URL
Hello, I'm using AVR (Application Visibility Reporting)for my F5 Big IP LTM traffic. When i'm going to my statistics, I can see 29 975 total entries for my URL. But When I try to export all of these URLs in CSV format, my CSV file contains only the first 10 entries. Do I need to apply a particular method to export all of my 29,975 entries to the same CSV file to process this data? Thanks for your help, Hugo307Views1like0CommentsDNS Analytics / Statistics
Hi, Is the DNS services license required to get DNS Analytics / Statistics via the DNS Profile? It's 100% configurable without the license (i.e I have configured analytics sampling in the profile), however I get no statistics or analytics data. I've trawled through documentation, however nowhere does it state that the license is required. Thanks, Andrew259Views0likes0CommentsGTM to Splunk
Hi Everyone, We have a requirement where in we need to send GTM Logs/Statistics to our Splunk logging server. May we know what parameters can be pulled from the GTM Logs/Statistics that we can send to the Splunk? An example is which WIP uses the most bandwidth or the trend of the ISP Bandwidth usage to determine the time/day the peak is reached. our F5 DNS is running on 13.1.0.4 software version if possible, how can we implement this in our GTM and Splunk? Hope someone can give us an article. Thank you.512Views0likes1CommentBIG-IQ v. 5.0- how to view traffic statistics from installed BIG-IP devices
Hello, I have successfully added 4 BIG-IP devices to BIG-IQ from Device Management > BIG-IP DEVICES > Add Device (after installing the required framework using "update_bigip.sh"). Next, I imported the Local Traffic module (LTM) for each BIG-IP from Device Management > Services. Virtual Servers, Pools, etc. for each BIG-IP are being displayed properly in the ADC. My question is- how do I view traffic statistics for virtual servers on each BIG-IP? Specifically, I'm looking for information from the following section of a BIG-IP device: Statistics ›› Module Statistics : Local Traffic ›› Virtual Servers : "virtual_server_name" (this is where the "Traffic Details" in "Bits", "Packets", and "Connections" are displayed). -Thank youSolved703Views0likes8Comments


