monitoring
1726 Topics
ADC03: Incomplete Observability – A Critical Application Delivery Challenge
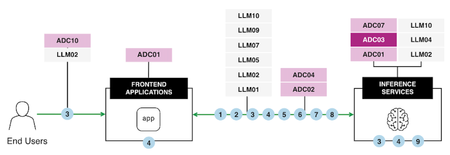
Observability is the backbone of modern application delivery, enabling the detection of performance issues, analyzing system usage, and monitoring overall health. However, Incomplete Observability, characterized by insufficient logging, inadequate monitoring tools, and inconsistent data collection, introduces significant business risks. These risks range from limited visibility into performance bottlenecks and prolonged service disruptions to flawed scaling decisions and inefficient operations. To address these challenges effectively, it is crucial to understand the core issues at hand and implement robust strategies and tools, such as F5 BIG-IP and OpenTelemetry, that enhance observability across the infrastructure. Let's explore the impacts of Incomplete Observability and practical solutions, incorporating lessons from a real-world use case. AI Reference Architecture In an AI-powered application ecosystem, observability plays a pivotal role in coordinating and monitoring interactions between end users, frontend applications, and inference services. The following AI Reference Architecture diagram illustrates a typical flow: Diagram Overview: End Users initiate requests through frontend applications. These applications connect with backend Large Language Models (LLMs) based on user-specific needs. Inference Services operate at the core, processing data to deliver accurate and efficient results. Monitoring critical pipelines ensures reliability and scalability while maintaining secure data flows. By aligning observability with such an architecture, AI systems can handle complex pipelines effectively, optimizing performance, security, and governance. Consequences of Incomplete Observability Impact on Performance The absence of complete observability limits an organization’s ability to proactively detect and resolve performance bottlenecks. Without detailed insights into key metrics like latency, response times, and resource utilization, it becomes nearly impossible to identify root causes or improve application responsiveness. For example, undetected spikes in CPU or memory usage can lead to degraded user experiences and even system crashes. Impact on Availability Incomplete observability hampers availability—an essential component of application delivery. Downtime and overlooked critical failures are costly, with 32% of organizations reporting an average outage cost exceeding $500,000 per hour (New Relic). For distributed systems, limited visibility can cause cascading failures, with a minor issue in one system component triggering widespread service interruptions before being detected. Impact on Scalability Dynamic and scalable infrastructure is essential for supporting modern applications with variable workloads. Incomplete observability creates significant obstacles in tracking traffic trends and resource utilization accurately, leading to resource under-provisioning or over-provisioning that wastes budgetary resources or results in outages. Impact on Operational Efficiency Operational inefficiencies arise when IT teams are forced to sift through fragmented, inconsistent data sets to identify issues. Logs spread across incompatible formats or disconnected tools lead to delays in troubleshooting and limited optimization opportunities. This reduces teams' ability to respond to incidents promptly and improve overall system performance. Best Practices for Overcoming Observability Gaps F5's BIG-IP and OpenTelemetry address these challenges by delivering end-to-end observability capabilities requiring real-time insights into application health, performance bottlenecks, and operational metrics. These tools facilitate timely root cause analysis and enable proactive management of distributed systems. Enhanced Observability Framework: Use Case Overview The following diagram illustrates a practical implementation of comprehensive observability using tools like F5 BIG-IP and OpenTelemetry: Use Case Breakdown Consolidate Traffic via F5 BIG-IP LT BIG-IP LTM acts as a centralized point for SSL termination, iRules, and high-speed logging, capturing critical metrics like latency, VIP health, and trace IDs. Traffic is centrally analyzed to provide real-time visibility into application flow dynamics. Capture and Export Logs & Metrics Key metrics, logs, traces, and request IDs are captured and exported for downstream analysis. Logs are standardized across systems, ensuring that valuable data isn't lost in noise. Standardize Observability with OpenTelemetry OpenTelemetry normalizes diverse observability patterns into a unified data model. This enables cross-system compatibility and real-time trend comparisons in distributed environments. Implement Dynamic Alerts & Automated Responses Configure dynamic alerting systems to notify teams when anomalies are detected and integrate automated responses for tasks such as scaling resources or rerouting traffic. Create Unified Dashboards & Analytics Observability platforms like ELK, Prometheus, and Datadog aggregate logs and metrics into a central dashboard, delivering actionable intelligence to IT teams. Establish Feedback Loops for Continuous Improvement Feedback loops using historical performance data enable ongoing improvements in application delivery processes. Insights refine operational decisions and better align infrastructure with real-time demand. Key Benefits Enhanced visibility into application flows, including API interactions, access patterns, and system utilization. Rapid issue detection and mitigation using real-time analytics and automated responses. Resource optimization ensures cost-effective scaling aligned with workload demands. Improved governance and security through dynamic control of inter-application communications. Conclusion Incomplete observability disrupts critical aspects of performance, availability, scalability, and operational efficiency. By leveraging solutions like F5 BIG-IP and OpenTelemetry, alongside enhanced observability frameworks, organizations can address visibility gaps effectively. Dynamic alerting systems, unified dashboards, and standardization tools enable real-time insights, fostering a culture of data-driven decisions and continuous service improvement. Observability is no longer just a supporting feature. It has become the strategic foundation for reliable, high-performing, and secure digital ecosystems. Start improving your observability practices today to achieve long-term success in application delivery. Reference Articles Enhancing BIG-IP with F5 Distributed Cloud: Automated Service Discovery for Scalable Application Delivery and Security Adopting SRE practices with F5: Observability and beyond with ELK Stack Monitor Application Availability with F5 BIG-IP LTM Why Application Observability and Insights Matter Gain insights into the performance of your F5 BIG-IP LTM and DNS solutions ADSP Platform overview The Application Delivery Top 10 AI reference architecture77Views1like0CommentsTelemetry Streaming: getting HTTP statistics via SNMP
Hi F5 community, I am looking to get HTTP statistics (total count, and broken by response code) metrics from Telemetry Streaming via SNMP (seems to be the most viable option). F5-BIGIP-LOCAL-MIB::ltmHttpProfileStat oid: .1.3.6.1.4.1.3375.2.2.6.7.6 However, the stats don't seem to come out correct at all: I do see deltas happening, but they don't match at all the traffic rate I expect to see. Furthermore, I have done some tests where I would start a load testing tool (vegeta) to fire concurrent HTTP requests, for which I do see the logs from the virtual server, but no matching increment in the above SNMP OID entries on none of the profiles configured. What am I doing wrong? does something need to be enabled on the HTTP profile in use to collect those stats? Best, Owayss215Views0likes0Comments
monitor a pool that consists of Linux Squid Servers
I am trying to monitor a pool that consists of Linux Squid Servers. The issue I am having is when a squid servers service stops processing requests and the port 3128 is sgtill responding, the pool members do not go down. The squid server then starts to generate timeouts to the client. We have created a custom script/external monitor that does a CURL to a paticular destination while expecting a specific return string. We used the following KB artical to attempt to monitor them (https://my.f5.com/manage/s/article/K31435017). The issue is, When we apply the External monitor to the pool, it has no way of accepting the UP or DOWN status that is being returned by the script. How do I tell the F5 to expect a receive string and remove the node from the pool using this external monitor. Script: # start sample script #!/bin/sh # (c) Copyright 1996-2007 F5 Networks, Inc. # # @(#) $Id: http_monitor_cURL+GET,v 1.0 2007/06/28 16:10:15 deb Exp $ # (based on sample_monitor,v 1.3 2005/02/04 18:47:17 saxon) # # these arguments supplied automatically for all external monitors: # $1 = IP (IPv6 notation. IPv4 addresses are passed in the form # ::ffff:w.x.y.z # where "w.x.y.z" is the IPv4 address) # $2 = port (decimal, host byte order) # # Additional command line arguments ($3 and higher) may be specified in the monitor template # This example does not expect any additional command line arguments # # Name/Value pairs may also be specified in the monitor template # This example expects the following Name/Vaule pairs: # URI = the URI to request from the server # RECV = the expected response (not case sensitive) # # remove IPv6/IPv4 compatibility prefix (LTM passes addresses in IPv6 format) IP=`echo ${1} | sed 's/::ffff://'` PORT=${2} PIDFILE="/var/run/`basename ${0}`.${IP}_${PORT}.pid" # kill of the last instance of this monitor if hung and log current pid if [ -f $PIDFILE ] then echo "EAV exceeded runtime needed to kill ${IP}:${PORT}" | logger -p local0.error kill -9 `cat $PIDFILE` > /dev/null 2>&1 fi echo "$$" > $PIDFILE # send request & check for expected response website="https://mywebsite.com" timeout_seconds=5 response_code=$(curl --write-out "%{http_code}" --silent --output /dev/null --max-time $timeout_seconds $website) if [ "$response_code" == "200" ]; then rm -f $PIDFILE echo "UP" else rm -f $PIDFILE # echo "DOWN" fi exit391Views0likes2CommentsLTM Monitoring IIS and Webserver Binding
Hello, we've got a VS for 2 MS IIS Webserver. Question: if I configure the Pool with regular Nodes, the Monitor connects the Nodes with the IP Adress, right? Then I've got a problem with the Webserver-Binding (only Bindings for hostname and Website-Name) What if I configure the Pool with fqdn-Node? Is it sure, Monitor connects with hostname? when I make from BIG-IP a curl -k https://webbvk1.bvk.int/Smoke-Test I get the Response ...Smoketest... but with a Pool with webbvk1.bvk.int and webbvk2.bvk.int as fqdn-Node, the members are marked as down. webbvk1 & 2 are CNAMEs Send-String: HEAD /Smoke-Test HTTP/1.0\r\n\r\n Receive-String: Smoketest any Idea, where I could look for? Or a Problem with the IIS? Thank youSolved1.2KViews0likes6Comments
Health Monitors
Hi, I have created a health monitor with the following config: Interval 5 Timeout 16 Send String GET /test/test.jsp Receive String HTTP 1\.(0|1) 200 Reverse No Transparent No Alias address ALL Alias Service Port ALL But whne I go to add it to a specific node choosing NODE SPECIFIC I cannot see the monitor I created inside the list. Do I need to do anything else to make the monitor a node specific one? Thanks.1.5KViews0likes16CommentsGTM - Lingo translated from an LTM perspective (and monitoring)
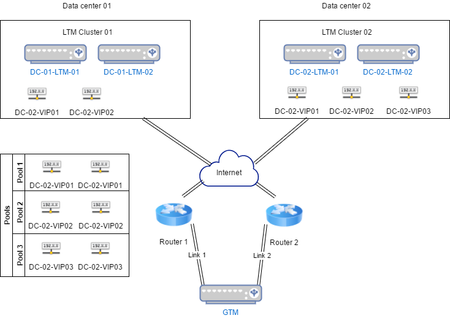
Dear experts I've set out to find typically good stuff to monitor on the GTM and to do that I had to re-evaluate some terms and things I took for granted from the LTM world. I thought I'd share what I have written down. Hopefully it will help some other poor soul coming from the LTM side to get the grip of the basics. Please do comment if (or actually rather when) I've misunderstood something? A diagram of a basic set-up Lingo Server This is the equivalent of an F5 unit (or a generic server). Data center This is more or less just a container with Servers in them. Data center availability is determined by doing an aggregate checks of virtual server statuses. If all virtual servers are down, the data-center is down, otherwise not. Virtual server These are the classical virtual servers we know from the LTM. Wide IP This is the actual dns record and it's aliases. The wide IP uses a pool containing one or more LTM virtual servers (or, a manually defined fallback server IP). The GTM uses the pool to select the best server based on criteria defined by the admin (GEO-IP based, connections, just plain round-robin, irules etc.). Link A link is a possible path to the internet. In case a GTM is connected to multiple routers it can also use multiple links in case one, or more of the routers is unavailable. If all links are down, the objects monitored via those links also goes down. If no link is specified the GTM would use the configured routing. Listeners This is where the clients would send their DNS queries. You must have at least one in order for GTM to work, but more than one is also possible. Monitoring of virtual servers The GTM would not monitor F5 devices like the LTM monitors its pool members and nodes. Instead it establishes a trust with the devices by running the bigip_add (a bit like device trust) and then the monitoring is done through iQuery. Monitoring In order to get a basic monitoring going I've thought out the following parts. Please let me know if something should be added? Availability: Server availability Data center availability Virtual server availablity Wide IP availability* Link availability Status of iQuery Statistics: Memory, CPU, throughput etc Requests per Wide IP Unhandled requests per Wide IP Total requests per GTM Total unhandled requests per GTM Any comments/feedback very much appreciated!674Views0likes4Comments
SNMP ltmPoolMemberMonitorState - OID Truncation Rules
Hi, is anyone aware of the, seemingly "new" OID truncation scheme for long oids? We have just upgraded from 11.4 to 12.1 and our snmp queries are not predictable anymore. The once working query is (for example): F5-BIGIP-LOCAL-MIB::ltmPoolMemberMonitorState."/Common/Pool_re_dac_ted_ultralong_pool_name_xyzxyzxyzxyzxyzxyzxyzxyzxyzxyzxyzxyzxyzxyz"."/Common/MEMBER1".443 Now we need to query for: F5-BIGIP-LOCAL-MIB::ltmPoolMemberMonitorState."/Common/Pool_re_dac_ted_ultralong_pool_name_xyzxyzxyzxyzxyzxyzxyzxyzxyzxyzxyzx9d3d7c89"."/Common/MEMBER2".443 Is anyone aware, how the 9d3d7c89 is calculated, so I can update our scripts? Unfortunately we are not able to change the monitoring to iControl/ssh/... and the usage of snmp is obligatory for us by now. Thanks in advance and regards, \seb409Views0likes0Comments
Unable to add EM route from tmsh
Has anyone else stumbled when trying to add a more specific route to the management-routes on LTM 11.2.0? Trying to add a host route to my EM's to the management-route list and get root@(ddc-7-vpr1-dmz)(cfg-sync In Sync)(/S1-green-P:Active)(/Common)(tmos) create sys management-route par-em-1 10.0.0.0/8 gateway 10.21.13.154 01070734:3: Configuration error: invalid management route, the dest/netmask pair ::/ffff:ffff:ffff:ffff:ffff:ffff:ffff:ffff already exists for /Common/10.0.0.0_8 root@(ddc-7-vpr1-dmz)(cfg-sync In Sync)(/S1-green-P:Active)(/Common)(tmos) The route can be added by editing the bigip_base.conf file... And then loading the config. Which works. But tmsh seems determined not to allow me to add them... H383Views0likes2CommentsConfig sync taking a long time
Hi, I'm runnnig a failover cluster between BIG-IP 10.2.1 473.0 (same version for both members) and was wondering if it was normal that whenever I sync the configurations, it takes more than 2 minutes to do so. From the standby unit to the active: [Standby] ~ time b config sync Checking configuration on local system and peer system... Peer's IP address: 192.168.1.2 Synchronizing Master Keys... Saving active configuration... tar: conf/ssl.crt/server.crt: time stamp 2035-06-29 22:13:37 is 754214057 s in the future tar: conf/ssl.key/server.key: time stamp 2035-06-29 22:13:37 is 754214057 s in the future tar: ssl/ssl.key/default.key: time stamp 2035-06-29 22:13:19 is 754214039 s in the future Configsync Mode: Push Transferring UCS to peer... Installing UCS on peer... Obtaining results of remote configuration installation... Saving active configuration... tar: conf/ssl.crt/server.crt: time stamp 2035-06-29 22:13:37 is 754214045 s in the future tar: conf/ssl.key/server.key: time stamp 2035-06-29 22:13:37 is 754214045 s in the future tar: ssl/ssl.key/default.key: time stamp 2035-06-29 22:13:19 is 754214027 s in the future Current configuration backed up to /var/local/ucs/cs_backup.ucs. Product : BIG-IP Version : 10.2.1 Hostname: UCS : standby_f5 System: active_f5 Installing --shared-- configuration on host active_f5 Installing configuration... Installing ASM configuration... Post-processing... Reading configuration from /config/low_profile_base.conf. Reading configuration from /defaults/config_base.conf. Reading configuration from /config/bigip_sys.conf. Reading configuration from /config/bigip_base.conf. Reading configuration from /usr/share/monitors/base_monitors.conf. Reading configuration from /config/profile_base.conf. Reading configuration from /config/daemon.conf. Reading configuration from /config/bigip.conf. Reading configuration from /config/bigip_local.conf. Loading the configuration ... Loading ASM configuration... real 2m11.046s user 0m4.795s sys 0m2.269s From the active unit to the standby: [Active] config time b config sync Checking configuration on local system and peer system... Peer's IP address: 192.168.1.1 Synchronizing Master Keys... Saving active configuration... tar: conf/ssl.crt/server.crt: time stamp 2035-06-29 22:13:37 is 754213385 s in the future tar: conf/ssl.key/server.key: time stamp 2035-06-29 22:13:37 is 754213385 s in the future tar: ssl/ssl.key/default.key: time stamp 2035-06-29 22:13:19 is 754213367 s in the future Configsync Mode: Push Transferring UCS to peer... Installing UCS on peer... Obtaining results of remote configuration installation... Saving active configuration... tar: conf/ssl.crt/server.crt: time stamp 2035-06-29 22:13:37 is 754213351 s in the future tar: conf/ssl.key/server.key: time stamp 2035-06-29 22:13:37 is 754213351 s in the future tar: ssl/ssl.key/default.key: time stamp 2035-06-29 22:13:19 is 754213333 s in the future Current configuration backed up to /var/local/ucs/cs_backup.ucs. Product : BIG-IP Version : 10.2.1 Hostname: UCS : active_f5 System: standby_f5 Installing --shared-- configuration on host standby_f5 Installing configuration... Installing ASM configuration... Post-processing... Reading configuration from /config/low_profile_base.conf. Reading configuration from /defaults/config_base.conf. Reading configuration from /config/bigip_sys.conf. Reading configuration from /config/bigip_base.conf. Reading configuration from /usr/share/monitors/base_monitors.conf. Reading configuration from /config/profile_base.conf. Reading configuration from /config/daemon.conf. Reading configuration from /config/bigip.conf. Reading configuration from /config/bigip_local.conf. Loading the configuration ... Loading ASM configuration... real 2m4.418s user 0m5.088s sys 1m7.987s This is the result after I restarted httpd (it used to take 3 to 5 minutes before I did that!) I noticed the comand that takes most time is /usr/local/bin/SOAPCSClient --source /var/tmp/__sync_local__.ucs --destination __sync_remote__.ucs Restarting httpd seems to have improved that but is it normal for the members to spend that much time on syncing? I read this post (http://devcentral.f5.com/Community/GroupDetails/tabid/1082223/asg/44/aft/1167199/showtab/groupforums/Default.aspx) but it didn't improve performance and as it is said this not recommended, i did not apply the changes to httpd configuration. httpd log shows this when syncing from standby to active (I know I should do the opposite but the devs who wrote the automatic script that makes changes and apply them never changed the target after the active member changed): Aug 5 16:33:24 slot1/cld0065lb err httpd[17979]: [error] [client 192.168.1.1] FastCGI: comm with server "/usr/local/www/iControl/iControlPortal.cgi" aborted: idle timeout (300 sec) Aug 5 16:33:24 slot1/cld0065lb err httpd[17979]: [error] [client 192.168.1.1] FastCGI: incomplete headers (0 bytes) received from server "/usr/local/www/iControl/iControlPortal.cgi" Thanks in advance! Regards, Pierre766Views0likes7Comments
user_alert.conf and automation - good stuff!
For a description on how user_alert.conf works & syntax rules, see http://devcentral.f5.com/Community/GroupDetails/tabid/1082223/asg/44/aft/1178752/showtab/groupforums/Default.aspx http://devcentral.f5.com/Community/GroupDetails/tabid/1082223/asg/44/aft/55956/showtab/groupforums/Default.aspx http://support.f5.com/kb/en-us/solutions/public/3000/600/sol3667.html http://support.f5.com/kb/en-us/solutions/public/3000/700/sol3727.html http://support.f5.com/kb/en-us/solutions/public/12000/400/sol12428.html With new messages available in 10.2 such as: Aug 17 10:34:31 local/localhost notice mcpd[5571]: 01070727:5: Pool member 10.10.10.1:80 monitor status up. Aug 17 10:34:31 local/tmm7 err tmm7[7389]: 01010221:3: Pool your-cool-pool now has available members combined with the older and very useful messages: Aug 17 10:34:22 local/localhost notice mcpd[5571]: 01070638:5: Pool member 10.10.10.1:80 monitor status down. Aug 17 10:34:22 local/tmm9 err tmm9[7404]: 01010028:3: No members available for pool your-cool-pool you can now perform actions on the F5 itself based on a pool becoming totally unavailable. In the /config/user_alert.conf file, you can include statements like: /* This works with my cool pool */ alert your-cool-pool-DOWN "No members available for pool your-cool-pool" { exec command="/config/monitors/MyScript 'your-cool-pool' 'down'" } alert your-cool-pool-UP "Pool your-cool-pool now has available members" { exec command="/config/monitors/MyScript 'your-cool-pool' 'up'" } This provides a complete solution to taking an action when a pool goes up or down. WARNING: Since alertd only examines the /var/log/ltm syslog-ng message body, you can not detect which TMM instance (CPU) cut the message. Since the script has no access to the complete message that triggered the execution, you are left with the challenge to develop your own concurrency collision race condition handler through a lock file of some sort.594Views0likes3Comments