logging
92 Topics
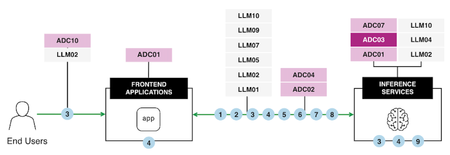
ADC03: Incomplete Observability – A Critical Application Delivery Challenge
Observability is the backbone of modern application delivery, enabling the detection of performance issues, analyzing system usage, and monitoring overall health. However, Incomplete Observability, characterized by insufficient logging, inadequate monitoring tools, and inconsistent data collection, introduces significant business risks. These risks range from limited visibility into performance bottlenecks and prolonged service disruptions to flawed scaling decisions and inefficient operations. To address these challenges effectively, it is crucial to understand the core issues at hand and implement robust strategies and tools, such as F5 BIG-IP and OpenTelemetry, that enhance observability across the infrastructure. Let's explore the impacts of Incomplete Observability and practical solutions, incorporating lessons from a real-world use case. AI Reference Architecture In an AI-powered application ecosystem, observability plays a pivotal role in coordinating and monitoring interactions between end users, frontend applications, and inference services. The following AI Reference Architecture diagram illustrates a typical flow: Diagram Overview: End Users initiate requests through frontend applications. These applications connect with backend Large Language Models (LLMs) based on user-specific needs. Inference Services operate at the core, processing data to deliver accurate and efficient results. Monitoring critical pipelines ensures reliability and scalability while maintaining secure data flows. By aligning observability with such an architecture, AI systems can handle complex pipelines effectively, optimizing performance, security, and governance. Consequences of Incomplete Observability Impact on Performance The absence of complete observability limits an organization’s ability to proactively detect and resolve performance bottlenecks. Without detailed insights into key metrics like latency, response times, and resource utilization, it becomes nearly impossible to identify root causes or improve application responsiveness. For example, undetected spikes in CPU or memory usage can lead to degraded user experiences and even system crashes. Impact on Availability Incomplete observability hampers availability—an essential component of application delivery. Downtime and overlooked critical failures are costly, with 32% of organizations reporting an average outage cost exceeding $500,000 per hour (New Relic). For distributed systems, limited visibility can cause cascading failures, with a minor issue in one system component triggering widespread service interruptions before being detected. Impact on Scalability Dynamic and scalable infrastructure is essential for supporting modern applications with variable workloads. Incomplete observability creates significant obstacles in tracking traffic trends and resource utilization accurately, leading to resource under-provisioning or over-provisioning that wastes budgetary resources or results in outages. Impact on Operational Efficiency Operational inefficiencies arise when IT teams are forced to sift through fragmented, inconsistent data sets to identify issues. Logs spread across incompatible formats or disconnected tools lead to delays in troubleshooting and limited optimization opportunities. This reduces teams' ability to respond to incidents promptly and improve overall system performance. Best Practices for Overcoming Observability Gaps F5's BIG-IP and OpenTelemetry address these challenges by delivering end-to-end observability capabilities requiring real-time insights into application health, performance bottlenecks, and operational metrics. These tools facilitate timely root cause analysis and enable proactive management of distributed systems. Enhanced Observability Framework: Use Case Overview The following diagram illustrates a practical implementation of comprehensive observability using tools like F5 BIG-IP and OpenTelemetry: Use Case Breakdown Consolidate Traffic via F5 BIG-IP LT BIG-IP LTM acts as a centralized point for SSL termination, iRules, and high-speed logging, capturing critical metrics like latency, VIP health, and trace IDs. Traffic is centrally analyzed to provide real-time visibility into application flow dynamics. Capture and Export Logs & Metrics Key metrics, logs, traces, and request IDs are captured and exported for downstream analysis. Logs are standardized across systems, ensuring that valuable data isn't lost in noise. Standardize Observability with OpenTelemetry OpenTelemetry normalizes diverse observability patterns into a unified data model. This enables cross-system compatibility and real-time trend comparisons in distributed environments. Implement Dynamic Alerts & Automated Responses Configure dynamic alerting systems to notify teams when anomalies are detected and integrate automated responses for tasks such as scaling resources or rerouting traffic. Create Unified Dashboards & Analytics Observability platforms like ELK, Prometheus, and Datadog aggregate logs and metrics into a central dashboard, delivering actionable intelligence to IT teams. Establish Feedback Loops for Continuous Improvement Feedback loops using historical performance data enable ongoing improvements in application delivery processes. Insights refine operational decisions and better align infrastructure with real-time demand. Key Benefits Enhanced visibility into application flows, including API interactions, access patterns, and system utilization. Rapid issue detection and mitigation using real-time analytics and automated responses. Resource optimization ensures cost-effective scaling aligned with workload demands. Improved governance and security through dynamic control of inter-application communications. Conclusion Incomplete observability disrupts critical aspects of performance, availability, scalability, and operational efficiency. By leveraging solutions like F5 BIG-IP and OpenTelemetry, alongside enhanced observability frameworks, organizations can address visibility gaps effectively. Dynamic alerting systems, unified dashboards, and standardization tools enable real-time insights, fostering a culture of data-driven decisions and continuous service improvement. Observability is no longer just a supporting feature. It has become the strategic foundation for reliable, high-performing, and secure digital ecosystems. Start improving your observability practices today to achieve long-term success in application delivery. Reference Articles Enhancing BIG-IP with F5 Distributed Cloud: Automated Service Discovery for Scalable Application Delivery and Security Adopting SRE practices with F5: Observability and beyond with ELK Stack Monitor Application Availability with F5 BIG-IP LTM Why Application Observability and Insights Matter Gain insights into the performance of your F5 BIG-IP LTM and DNS solutions ADSP Platform overview The Application Delivery Top 10 AI reference architecture79Views1like0Comments
HSL - Local TimeZone - in syslog server
Dear all, hope you are doing well. I have a question about the HSL timestamps which is sending by default. When we were using the standard syslog, in the log messages we had the local-timezone But, while we are swithing to HSL, it is in UTC . Apr 29 09:22:26 hostname.omitted debug tmm1[19608]: Rule <output omitted <- Standard Syslog logging Apr 29 07:22:26 hostname.omitted 29/04/2026 09:22:26 <output omitted, the Timestamp is from irule> <- HSL is it possible somehow to get as well the localtimezone, without modifying the syslog KR Peter57Views0likes0Comments
How to add Syslog headers to Bot Defense logs over HSL? (Missing formatting options)
Hi DevCentral Community, I am running into issue with logging Bot Defense events to our SEIM (AIsaac) and could use some advice on best practices. We have logging profile configured to send both Application Security (ASM) and Bot Defense logs to a Remote Publisher. The Publisher is currently tied to a Remote HSL(High-Speed-Logging) destination. The Problem: For standard ASM WAF logs, we can easily format the log string directly in the GUI under the Applications Security logging tab. However, under the Bot Defense logging tab, there is no option to customize the log format. Because it is sending directly to a raw HSL destination, the Bot Defense logs are arriving at out SEIM completely stripped of standard Syslog headers. Without these headers, the SEIM cannot parse the logs correctly. My Questions: Is inserting a Syslog formatted destination before the HSL destination the official way to inject standard headers into Bot Defense logs? Is there any hidden tmsh command or iRule method to actually customize the Bot Defense log payload format, or is the payload structure strictly fixed by the system?250Views0likes1Comment
High Speed Logging vs Telemetry Streaming (Logging to SIEM)
My goals is to send web application traffic logs from my virtual servers to an external SIEM. It looks like there are quite a few ways to approach this, so I want to check with the community to see what works best for you. Ideally, this would be a high-volume configuration with logging enabled for 400+ public virtual servers. At a minimum, I would like to collect the client IP, user agent, URI path, virtual IP, virtual server name, pool, server name, and server-side response code. I reviewed the overview here: Getting Started with iRules: Logging & Comments | DevCentral It is clear that High Speed Logging (HSL) would be the preferred approach to ensure the resource and capacity burden is placed on the TMM (data plane) and not the control/management plane and to avoid writing to disk on the F5 BIG-IP host. I could write to syslog servers and forward these logs to my SIEM. The HSL seems to be straight forward to configure with a sample iRule looking like: when CLIENT_ACCEPTED { set vs [IP::local_addr]:[TCP::local_port] # Open HSL connections with configured pools set hsl_pool_1 [HSL::open -proto UDP -pool Pool_Syslog_1] set hsl_pool_2 [HSL::open -proto UDP -pool Pool_Syslog_2] } when SERVER_CONNECTED { set client [IP::client_addr]:[TCP::client_port] set srv [IP::remote_addr]:[TCP::remote_port] set log_message "<134>Client: $client connected to $vs and routed to server $srv at [clock format [clock seconds] -format \"%Y-%m-%d %H:%M:%S\"]" # Send logs to both HSL pools HSL::send $hsl_pool_1 $log_message HSL::send $hsl_pool_2 $log_message } However, when I searched through the DevCentral forums for references to SIEM logging, I found that most examples used Telemetry Streaming and AS3 for configuration. An official KB can be found here: Configure Azure sentinel or other telemetry consumer integration with BIG-IP and there is a f5devcentral github publication with configuration declarations for this approach for multiple SIEM vendors (e.g., analytics-vendor-dashboards/elastic at main · f5devcentral/analytics-vendor-dashboards for Elastic) For a use case like mine that involves high-volume logging in BIG-IP, do you know if HSL or Telemetry Streaming would be best to minimize the impact on BIG-IP?1KViews0likes1CommentPool used with HSL::open - what are the requirements? Any way to make it send using TLS?
Hi - we have a vendor integration that captures and logs request and response data for calls to virtual servers via an iRule that uses HSL::open/HSL::send. For this, they have us: Creating a local HTTP port 80 virtual server, with an SSL server profile and their TLS collection server endpoints as members; and, Creating a logging pool that has that local HTTP virtual server as a member; and, Creating an iRule (which they provide) that does an HSL::open on that logging pool, and after formatting request/payload/response data, does an HSL::send That formatted data then goes to the logging pool entry, which in turn sends it to the port 80 VIP, which in turn sends it, using TLS, to their collection servers. I'm assuming that their iRule is therefore responsible for formatting the stream sent to the logging pool into valid HTTP, which then just gets passed "raw" to their HTTP VIP, without any processing by the logging pool. (Is that a correct understanding?) My questions are: 1. Given that scheme, why can't the iRule skip the "logging pool", and just use the pool for the port 80 virtual server directly in the HSL::open? What value is added by having the iRule pass the stream being sent through a separate pool? If the content the iRule will send via the HSL::send is HTTP formatted anyway (my assumption), couldn't the HSL::send just as simply send it right to the pool for the virtual server? And, if it does so, is there any way to configure the virtual server to not even expose a port? 2. Alternatively - and even better - is there any way to configure the "logging pool" created above to send directly to the vendor's TLS collection servers - that is, do a TLS wrapping on the way out? (this may be tantamount to asking, is there any way to attach an SSL server profile to the pool, even though it doesn't have an owning virtual server, causing it to apply TLS)? The reason I ask is two-fold - their design is clumsy for us in that the logging pool can't directly send to the local VIP via the TMM plane (because of the issue described here), and as a result we have to add a static route to force the traffic out the management interface, increasing network load; and, having another VIP exposing port 80 is undesirable as a security risk (though we can and have blocked access to it ... still, we'll get serious side-eye from cybersecurity) Thank you for any information!Solved301Views0likes2CommentsLogging Server-IP with OneConnect
Due to the usage of SNAT (design requirement) the servers are loosing the visibility, which real clients are connecting. Therefor the LTM should provide these information with internal logging (client-IP <-> VS <-> server-IP). But we are also using OneConnect, where logging of all sub-sequent requests of an existing server-side connection are getting "lost". Is there any solution available to still provide such a full logging information with OneConnect enabled? Or is disabling OneConnect the only solution? Thank you! Regards Stefan :)63Views0likes0CommentsLog message code list?
SOL16197: Reviewing BIG-IP log files describes local traffic log message format as: Message code is split into: Message code: The code that is associated with the message. The code is comprised of the following sub-codes: Product Code: The first two hex digits form the product code. For example, 0x01 is the BIG-IP product code. Subset Code: The third and fourth hex digits are the subset code. For example, 0x2a is the subset code for LIBHAL. Message Number: The next four digits form the message number within a module. Severity Level: The last digit between the colon symbols is the severity level, with 0 being the highest severity level. Are the Product and Subset codes listed anywhere? Would help in processing log messages further in Splunk or similar tool.1.2KViews0likes5Comments
Logging Configuration in LTM HA
Hello everyone I'm doing a logging lab and I'm asking for your help to understand some things. I have two BIG-IP LTM in HA and a Qradar logging server. I have configured the Qradar as syslog servers at each HA node. At the Qradar level I receive the active logs but the standby only sends errors like "BIGIP_TMM_TIMMERR_PMBR_BACK_UP. I'd like to know if it's normal for the standby to send only error messages, and in general I'd like to understand how logging works in HA and what type of event each device sends to the server. thanks in advance470Views0likes2CommentsF5 APM Webtop - RDP Session Logging
Hello F5 Experts, I am relatively new to the F5 advanced ecosystem, am trying to generate useful logs from our APM Webtop environment and am hoping that someone can point me in the correct direction. I am trying to log the following things from our environment: Initial login's to the Webtop including ClientIP, Webtop portal address, Browser UserAgent, Client Username. (Optional) Client group membership/published resources when they log into Webtop. When a client opens a Web Portal Access from within Webtop including, ClientIP, Webtop portal address, Browser UserAgent, Client Username, Web Portal Access Address. (It would be good to get their session duration for this but that might not be fesable). When a client opens a RDP link from within the Webtop including, ClientIP, Webtop portal address, Browser UserAgent, Client Username, RDP Address, SessionCookie(?). When a client connects to a RDP session though the Webtop using one of the downloaded links, ClientIP, Webtop portal address, Client Username, RDP Address, SessionCookie(?), Session start and end time (Maybe two different log events?). From what I can tell this is likely to be an iRule. I think I have an idea how to do the Webtop portal logging, but what is really eluding me is how to log the RDP session connection and duration. Any help or a direction where to look would be greatly appreciated. Thank you,888Views0likes1CommentAPM - How to configure logging of snat addresses for network access and app tunnels
Hello everyone, we are using BIG-IP Access Policy Manager to enable administrative access to systems via App Tunnel and Network Access resources. For security reasons, we need to be able to map requests logged on backend resources/systems (e.g. in SSH audit logs) to the session or user accessing said backend resource via App Tunnel or Network Access in APM. Currently, the following request information is logged. Network Access: May 17 14:42:00 tmm0 tmm[22565]: 01580002:5: /APM/ap_rmgw:Common:c1237463: allow ACL: #app_tunnel_/APM/Some_App-Tunnel@c1237463:15 packet: tcp 192.168.12.18:58680 -> 10.0.0.1:22 App Tunnels: May 17 14:41:10 tmm1 tmm1[22565]: 01580002:5: /APM/ap_rmgw:Common:c6787463: allow ACL: #app_tunnel_/APM/Some_App-Tunnel@c6787463:0 packet: tcp 89.229.152.144:63252 -> 10.0.0.1:2 For Network Access requests, an IP address of the lease pool configured in the Network Access resource is logged as the client IP. For App Tunnel requests, the public IP of the client accessing APM is logged as the client IP. In our setup, both requests will be NATed by APM before hitting the target system (through a snat pool in case of a Network Access request, through the active appliances backend IP in case of App Tunnels). Therefore, the APM self IPs (snat pool/appliance backend) will be logged on the target host, leading to us not being able to correlate logs in APM with logs on the target systems. Is there any way to log the SNAT/NAT addresses and ports used to access target systems through APM? I've tried using ACCESS_ACL_ALLOWED in an iRule to log additional information, unfortunately this event only seems to trigger on Portal Access resources, not when using App Tunnels or Network Access resources. Thank you, Fabian2.3KViews0likes1Comment