devops
1650 TopicsKong API Gateway and BIG-IP on OpenShift
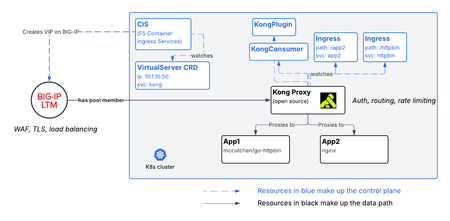
This article outlines the control plane and data plane for a BIG-IP + Kong API Gateway architecture. BIG-IP controls TLS termination, WAF, and ingress to cluster, and Kong performs rate limiting, authentication, and routing to endpoints.137Views2likes2CommentsUsing eBPF Filters to Capture and Inspect BIG-IP CNE CNF Traffic
Introduction In this article we go through integrated setup with both F5 BIG-IP eBPF Observability (EOB) and F5 BIG-IP Cloud-Native Edition (CNE) CNFs. In our lab we go through deploying BIG-IP EOB and start capturing client traffic within cnf-fw-01 namepsace. Capturing the traffic in this cloud-native architecture is as easy as creating the directive which automatically creates the streams and show the live capture. Step by Step deployment This video walks us through deploying the BIG-IP EOB through openshift operators hub, then creating the required directive to capture the client processed traffic and show it over BIG-IP EOB dashboard. Related Content F5 BIG-IP eBPF Observability (EOB) Deployment walkthrough | DevCentral eBPF Observability for Kubernetes & Cloud-Native Apps BIG-IP eBPF Observability (EOB) deployment walkthrough 52Views1like0Comments
Observing F5 BIG-IP CNE CNFs - V2 Metrics Aggregation walkthrough
Introduction Cloud-native distribution solves scale and resilience, but it fragments visibility. When TMM pods run across multiple Kubernetes nodes, logs and metrics scatter with them. The observer pod exists to pull that telemetry back into a single, coherent view. In a CNF deployment, multiple TMM pods run across Kubernetes nodes, each handling separate traffic slices. A coherent view of the entire dataplane requires aggregating those per-pod statistics. CNFs generate stats at high frequency across all TMM pods. Without aggregation, per-pod metric streams multiply quickly and do not compose cleanly into useful dashboard or alerting data. if you upgraded recently to CNF2.2+ you may have encountered new metrics behavior where, that's what we are covering here how V2 metrics change the metric collection and troubleshooting behavior. TODA Architecture: Four Components TODA (Telemetry, Observability, Diagnostics, and Analytics) is the stats collection and aggregation layer for CNFs. The distributed model has four roles: Component Description TMM Scraper Sidecar container in each TMM pod. Replaces tmstatsd. Serves metrics from tmctl over a gRPC response stream when requested by a Receiver. Receiver Runs as a StatefulSet. Scrapes metrics from assigned TMM Scrapers, persists them, and forwards to the Observer over gRPC with mutual TLS (mTLS). Handles metrics from terminated TMM pods so cumulative data is not lost mid-scrape. Observer Runs as a StatefulSet. The aggregation engine. Pulls from Receivers, aggregates metrics across all TMMs per table, and exports to the OTEL collector. Emits internal telemetry covering gRPC call metrics, aggregation performance, and storage state. Operator Runs as a Deployment. Orchestrates lifecycle: discovers TMM Scrapers, Receivers, and Observers; load-balances TMMs across Receivers; applies aggregation mode and collection interval settings via a ConfigMap. V1 vs. V2 CNF Metrics Choose before deploying. V1 and V2 use incompatible metric naming in Prometheus, so PromQL queries written for one will not work on the other. V1 (legacy): tmstatsd runs in each TMM pod and streams metrics directly to OTEL with no aggregation. Metric names look like: virtual_server_stat/spk-app-1-spk-app-tcp-8050-f5ing-testapp-virtual-server/clientside.bytes_out Each metric carries a tmmID attribute identifying the source pod. Six TMM pods means six separate data streams for the same virtual server. Dashboards scale poorly. V2 (current): The Receiver and Observer aggregate before export to OTEL. The equivalent metric: f5.virtual_server.clientside.received.bytes Attributes include f5.virtual_server.name, k8s.namespace.name, and observer.job.mode: aggregated. One metric, unified across all TMMs, with naming aligned to OpenTelemetry semantic conventions. Use V2 for new deployments. V1 remains only for environments not yet migrated. Deploying the Observer with Helm Install the Observer in the same namespace as your F5Ingress. Get the chart version from your CNFs software package: cd cnfinstall ls -1 tar | grep observer # f5-toda-observer-v4.56.4-0.0.15.tgz Create an observer_values.yaml. At minimum, set the image registry and storage class: image: repository: your-registry.example.com persistence: storageClassName: '' accessMode: ReadWriteOnce size: 3Gi platformType: robin fluentbit_sidecar: image: repository: your-registry.example.com fluentbit: tls: enabled: true fluentd: host: f5-toda-fluentd.cnf-gateway.svc.cluster.local. Install: helm install observer f5-toda-observer-<VERSION>.tgz -f observer_values.yaml Note: The Operator and Receivers share a volume. If they run on the same node, any StorageClass works. If Receivers are distributed across multiple nodes, use a ReadWriteMany-compatible StorageClass, NFS is the standard choice. In my lab I'm installing to a cne-core namespace instead of default namespace. Also, Make sure to update BIG-IP Controller ingress values, as below f5-tmm: ... ... observer: enabled: true image: repository: local.registry.com f5-toda-logging: enabled: true type: stdout fluentd: host: f5-toda-fluentd.cne-core.svc.cluster.local. tmstats: enabled: false Once updated upgrade your helm installation helm upgrade f5ingress f5ingress-v15.82.0-0.2.50.tgz -f deployment/values-ingress-v2.yaml -n cnf-fw-01 Now, you have all the components ready, you can reference the below steps for additional integrations with Grafana and Prometheus. Lab notes In my lab there are some commands I had to run to adjust to the openshift deployment, helm upgrade observer f5-toda-observer-5.22.10-0.2.4.tgz -n cne-core --reuse-values --set persistence.storageClassName=openebs-hostpath oc adm policy add-scc-to-user hostmount-anyuid -z f5-observer -n cne-core oc adm policy add-scc-to-user hostmount-anyuid -z f5-observer-operator -n cne-core oc adm policy add-scc-to-user hostmount-anyuid -z f5-observer-receiver -n cne-core oc secrets link f5-observer <secret> --for=pull -n cne-core oc secrets link f5-observer-operator <secret> --for=pull -n cne-core oc secrets link f5-observer-receiver <secret> --for=pull -n cne-core Wiring Prometheus and Grafana to CNF Metrics The OTEL collector exposes a Prometheus-compatible endpoint on TCP port 9090. It requires mTLS, so valid certificates must be in place before the scrape job succeeds. Step 1 — Create a Prometheus namespace and certificate: kubectl create namespace prometheus kubectl apply -f prom-certs.yaml # cert-manager Certificate manifest Step 2 — Configure Prometheus to scrape OTEL with TLS: serverFiles: prometheus.yml: scrape_configs: - job_name: bnk-otel scheme: https static_configs: - targets: - otel-collector-svc.default.svc.cluster.local:9090 tls_config: cert_file: /etc/prometheus/certs/tls.crt key_file: /etc/prometheus/certs/tls.key ca_file: /etc/prometheus/certs/ca.crt insecure_skip_verify: false server: extraVolumes: - name: prometheus-tls secret: secretName: prometheus-client-secret extraVolumeMounts: - name: prometheus-tls mountPath: /etc/prometheus/certs readOnly: true global: scrape_interval: 10s service: type: NodePort nodePort: 31929 persistentVolume: enabled: false Step 3 — Deploy via Helm: helm install prometheus oci://ghcr.io/prometheus-community/charts/prometheus \ -n prometheus --atomic -f values.yaml //Update otel config map and change line 47 to following debug: verbosity: detailed //Then add following at the end of the configmap exporters: - otlp - deb Step 4 — Verify the scrape target is healthy: curl http://<node-ip>:31929/api/v1/targets | jq Step 5 — List all CNF metrics currently ingested: curl http://<node-ip>:31929/api/v1/label/__name__/values | jq Step 6 — Run a quick query to validate data is flowing: curl "http://<node-ip>:31929/api/v1/query?query=f5_tmm_f5_pool_member_serverside_connections_count_total" | jq For Grafana, add Prometheus as a data source. F5 provides a pre-built Observer dashboard JSON on CloudDocs. The dashboard has three sections: gRPC metrics — Communication performance between Observer containers: call latency and request counts. Go Runtime metrics — Pod resource consumption: goroutine counts, heap memory, object allocation rates. Storage/Aggregation metrics — How the Observer handles dead TMM pod data. When a TMM pod terminates, the Observer runs merge operations to consolidate its metrics. This section shows whether those operations are healthy. Note, you need to update your OTEL definition to include the below //Update otel config map debug: verbosity: detailed //Then add following at the end of the configmap exporters: - otlp - deb //Apply updated OTEL configmap Once done, proceed to rollout the otel deployment oc rollout restart deployment otel-collector -n cnf-fw-01 oc logs otel-collector-6b5c9d5f89-qccqv -f | grep profile_tcp -> table: Str(profile_tcp_stat) -> table: Str(profile_tcp_stat) -> table: Str(profile_tcp_stat) -> table: Str(profile_tcp_stat) -> table: Str(profile_tcp_stat) -> table: Str(profile_tcp_stat) -> table: Str(profile_tcp_stat) -> table: Str(profile_tcp_stat) -> Name: f5.profile_tcp.accepts -> f5.profile_tcp.name: Str(tmstat_tcp) -> f5.profile_tcp.vs_name: Str(qkview_for_tmstatsd) -> observer.job.name: Str(cnf-fw-01/default-scrape-template-66456f74c4/default-job-profile_tcp_stat) -> Name: f5.profile_tcp.accepts -> f5.profile_tcp.name: Str(_mcptcp) -> f5.profile_tcp.vs_name: Str(grpc_mt_10:2) -> observer.job.name: Str(cnf-fw-01/default-scrape-template-66456f74c4/default-job-profile_tcp_stat) -> Name: f5.profile_tcp.accepts -> f5.profile_tcp.name: Str(_mcptcp) -> f5.profile_tcp.vs_name: Str(grpc_mt_4:0) -> observer.job.name: Str(cnf-fw-01/default-scrape-template-66456f74c4/default-job-profile_tcp_stat) -> Name: f5.profile_tcp.accepts -> f5.profile_tcp.name: Str(_mcptcp) -> f5.profile_tcp.vs_name: Str(_grpc_tmm_listener_9) -> observer.job.name: Str(cnf-fw-01/default-scrape-template-66456f74c4/default-job-profile_tcp_stat) -> Name: f5.profile_tcp.accepts -> f5.profile_tcp.name: Str(_cgctcp_in) Troubleshooting via Metrics V2 Now, we have better capabilities of actually monitoring traffic across multiple pods and TMMs from single location, [cloud-user@ocp-provisioner f5-cne-2.2.0]$ oc exec sts/f5-observer-receiver -n cne-core -- mdb --list | grep "/cnf-fw-01/" Defaulted container "f5-observer-receiver" out of: f5-observer-receiver, fluentbit 2026/07/15 18:12:09 INFO dialing to observer addr=0.0.0.0:8088 f5-log-ID=0612007a cnf-fw-01/tmm/f5-tmm-fcc888779-w98zh:f5-tmm:ae28ae8bf4ecb2de9f9a1d0674fb47f8acb2eab1bb46727e285e2cbcae87266b/cnf-fw-01/fw_context_stat 2026-07-15 18:11:22 763 cnf-fw-01/tmm/f5-tmm-fcc888779-w98zh:f5-tmm:ae28ae8bf4ecb2de9f9a1d0674fb47f8acb2eab1bb46727e285e2cbcae87266b/cnf-fw-01/virtual_server_stat 2026-07-15 18:11:22 3101 cnf-fw-01/tmm/f5-tmm-fcc888779-w98zh:f5-tmm:ae28ae8bf4ecb2de9f9a1d0674fb47f8acb2eab1bb46727e285e2cbcae87266b/cnf-fw-01/dns_cache_resolver_stat 2026-07-15 18:11:22 5162 cnf-fw-01/tmm/f5-tmm-fcc888779-w98zh:f5-tmm:ae28ae8bf4ecb2de9f9a1d0674fb47f8acb2eab1bb46727e285e2cbcae87266b/cnf-fw-01/profile_dns_stat 2026-07-15 18:11:22 7500 cnf-fw-01/tmm/f5-tmm-fcc888779-w98zh:f5-tmm:ae28ae8bf4ecb2de9f9a1d0674fb47f8acb2eab1bb46727e285e2cbcae87266b/cnf-fw-01/profile_tcp_stat 2026-07-15 18:11:22 972 cnf-fw-01/tmm/f5-tmm-fcc888779-w98zh:f5-tmm:ae28ae8bf4ecb2de9f9a1d0674fb47f8acb2eab1bb46727e285e2cbcae87266b/cnf-fw-01/pool_member_stat 2026-07-15 18:11:22 2156 cnf-fw-01/tmm/f5-tmm-fcc888779-w98zh:f5-tmm:ae28ae8bf4ecb2de9f9a1d0674fb47f8acb2eab1bb46727e285e2cbcae87266b/cnf-fw-01/fw_rule_stat 2026-07-15 18:11:22 1588 cnf-fw-01/tmm/f5-tmm-fcc888779-w98zh:f5-tmm:ae28ae8bf4ecb2de9f9a1d0674fb47f8acb2eab1bb46727e285e2cbcae87266b/cnf-fw-01/dos_stat 2026-07-15 18:11:22 3828 cnf-fw-01/tmm/f5-tmm-fcc888779-w98zh:f5-tmm:ae28ae8bf4ecb2de9f9a1d0674fb47f8acb2eab1bb46727e285e2cbcae87266b/cnf-fw-01/fw_container_stat 2026-07-15 18:11:22 1213 Now, let's have a closer look at one of the segments, below is the FW context [cloud-user@ocp-provisioner f5-cne-2.2.0]$ oc exec sts/f5-observer-receiver -n cne-core -- mdb --segment cnf-fw-01/tmm/f5-tmm-fcc888779-w98zh:f5-tmm:ae28ae8bf4ecb2de9f9a1d0674fb47f8acb2eab1bb46727e285e2cbcae87266b/cnf-fw-01/fw_context_stat Defaulted container "f5-observer-receiver" out of: f5-observer-receiver, fluentbit 2026/07/15 18:12:49 INFO dialing to observer addr=0.0.0.0:8088 f5-log-ID=0612007a -----BEGIN RESOURCE----- Meta: Name: fw_context_stat Unit: Annotations: k8s.namespace.name: cnf-fw-01 Labels: f5.firewall.context.context_name: cnf-fw-01-forwarding-any-virtual-server-SecureContext_vs f5.firewall.context.context_type: virtual f5.firewall.context.policy_type: 1 TTL: 0s Value: [2428 0 0 0] -----END RESOURCE----- Now, let's have a look at the virtual servers stats [cloud-user@ocp-provisioner f5-cne-2.2.0]$ oc exec sts/f5-observer-receiver -n cne-core -- mdb --segment cnf-fw-01/tmm/f5-tmm-fcc888779-w98zh:f5-tmm:ae28ae8bf4ecb2de9f9a1d0674fb47f8acb2eab1bb46727e285e2cbcae87266b/cnf-fw-01/virtual_server_stat Defaulted container "f5-observer-receiver" out of: f5-observer-receiver, fluentbit 2026/07/15 18:14:24 INFO dialing to observer addr=0.0.0.0:8088 f5-log-ID=0612007a -----BEGIN RESOURCE----- Meta: Name: virtual_server_stat Unit: Annotations: k8s.namespace.name: cnf-fw-01 Labels: f5.virtual_server.destination: 0.0.0.0 f5.virtual_server.name: cnf-fw-01-forwarding-any-virtual-server-SecureContext_vs f5.virtual_server.source: 0.0.0.0 TTL: 0s Value: [1844667 108023672 0 4 28282 69732 2542 0 0 0 0 108023672 1844587 0 4 69732 28280 2542] -----END RESOURCE----- -----BEGIN RESOURCE----- Meta: Name: virtual_server_stat Unit: Annotations: k8s.namespace.name: cnf-fw-01 Labels: f5.virtual_server.destination: 10.1.20.100 f5.virtual_server.name: cnf-fw-01-cnf-dohapp-virtual_server f5.virtual_server.source: 0.0.0.0 TTL: 0s Value: [0 0 0 0 0 0 0 0 0 0 0 0 0 0 0 0 0 0] -----END RESOURCE----- -----BEGIN RESOURCE----- Meta: Name: virtual_server_stat Unit: Annotations: k8s.namespace.name: cnf-fw-01 Labels: f5.virtual_server.destination: 10.1.30.100 f5.virtual_server.name: cnf-fw-01-dnsx-app-listener-virtual_server f5.virtual_server.source: 0.0.0.0 TTL: 0s Value: [0 0 0 0 0 0 0 0 0 0 0 0 0 0 0 0 0 0] -----END RESOURCE----- With Observer you have aggregated observer receiver to monitor and observe your CNF deployment. Conclusion As a conclusion, why would you go to V2 metrics vs V1, there are four pain points with V1 in distributed environments: Stream count; One virtual server across six TMM pods gives you six independent metric series in Prometheus, same stat, six rows, differentiated only by tmmID. That's not an observability system. That's a spreadsheet you have to reassemble manually every time you open Grafana. Data loss; A pod gets evicted mid-scrape and its cumulative counters are gone. The Receiver in the TODA pipeline holds that data in a local volume and merges it before export. Your charts stay clean. PromQL tax; In V1, every panel needs a sum() by (virtual_server) wrapper or the numbers are wrong. Not approximately wrong, it's wrong by a factor of N. V2 aggregates inside the pipeline, at the Observer, before the metric ever reaches Prometheus. One series. Use it directly. The naming; V1 embeds the VS name in the metric path. That's not how Prometheus is supposed to work, and everything downstream, like alerting rules, federation, label matchers fight it. V2 puts the VS identity where it belongs: as an attribute, f5.virtual_server.name. Short metric name, proper labels, and PromQL that actually reads like PromQL. The TODA pipeline ( TMM Scraper, Receiver, Observer ) exists specifically to close the visibility gap. The Receiver is the persistence layer. The Observer is the aggregation engine. Together they turn N pod streams into one coherent signal. If you take one thing from this: aggregation has to happen somewhere. In V1, it happens in your head, on every dashboard panel, every time. In V2, it happens in the pipeline, once, before the data leaves the cluster. That's the whole difference. Related Resources Distributed TODA for Stats Aggregation CNFs Event Logs Performance Visualization (Prometheus + Grafana) OTEL Statistics Reference CNF Log Formats Reference Debug Sidecar Overview Troubleshooting Common Errors 102Views3likes0Comments
F5 Distributed Cloud – Unit and Integration tests with Terraform
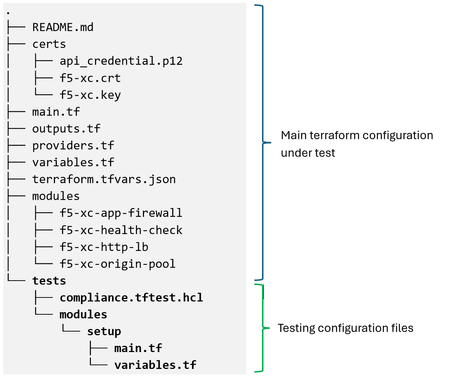
Introduction The Terraform test framework provides module authors with an integrated way to run unit and integration tests. It verifies that code changes do not introduce breaking behavior before production rollout. Terraform test prevents any risk on the existing state or infrastructure by keeping the state file in memory as an ephemeral entity. It never writes to a terraform state file, ensuring tests run completely separate from regular plan or apply workflows. The framework supports two testing models: Unit Testing: Runs a terraform plan to validate custom logic, calculations, and input conditions without provisioning real resources. This mode is fast, free, and runs entirely in memory. Integration Testing: Runs terraform apply to create temporary infrastructure, perform assertions against live resources, and automatically destroy those resources when the test completes. By default, test runs use command = apply, so integration testing creates real infrastructure and validates behavior against those deployed resources. To perform unit testing without creating infrastructure, you can override this behavior by setting the command attribute in a run block to plan. Configuration The following example shows a directory structure for terraform native tests: The main terraform configuration is based on the WAAP protected HTTP applications example: https://github.com/f5devcentral/f5-professional-services/tree/main/examples/f5-distributed-cloud/terraform/f5-xc-terraform-test. The compliance.tftest.hcl includes the logic to validate the following test cases: Check Compliance Run block Validate that a required Service Policy is inherited from the namespace if the Load Balancer is advertised on the public network and the origin server is behind a Customer Edge (CE) Security service_policy Validate that a required Service Policy is applied directly to the Load Balancer if it is advertised on the public network and the origin server is behind a CE Security service_policy Check that an App Firewall policy is applied to the HTTP Load Balancer if it is advertised on the public network Security app_firewall Verify that the Load Balancer name complies with the RFC 1035 Domain Names. Naming Governance http_load_balancer_name Verify that the HTTP Load Balancer quota is not exceeded. Resource governance quota_usage A helper module is included for managing test-specific resources such as data sources. It uses F5 Distributed Cloud Services API to get current quota usage for HTTP Load Balancers and the active namespace Service Policies: # setup module # Fetch data from a REST API data "http" "xc_quota_usage" { url = "${var.api_url}/web/namespaces/system/quota/usage" request_headers = { Accept = "application/json" } client_cert_pem = file(var.f5-xc_cert) client_key_pem = file(var.f5-xc_key) } data "http" "xc_active_sp" { url = "${var.api_url}/config/namespaces/${var.namespace}/active_service_policies" request_headers = { Accept = "application/json" } client_cert_pem = file(var.f5-xc_cert) client_key_pem = file(var.f5-xc_key) } # Use the response locals { xc_quota_usage = jsondecode(data.http.xc_quota_usage.response_body) xc_active_sp = jsondecode(data.http.xc_active_sp.response_body) } Below is the outputs.tf file for the module: output "xc_quota_usage" { value = { "HTTP" = local.xc_quota_usage.objects.http_loadbalancer.usage.current } } output "xc_active_sp" { value = local.xc_active_sp.service_policies[*].name } The variables.tf file used by the module is shown below: # setup module variables variable "tenant" { default = "<tenant_id>" } variable "api_url" { default = "https:// <tenant_name>.console.ves.volterra.io/api" } variable "f5-xc_cert" { default = "./certs/xc.crt" } variable "f5-xc_key" { default = "./certs/xc.key" } variable "namespace" { default = "default" } The main test file included in the test directory, compliance.tftest.hcl, contains the test logic within run blocks that applies a terraform “plan” or “apply” command to perform assertions on the resulting state: # compliance.tftest.hcl run "global_setup" { # This block initializes a module to fetch information required # for testing. module { source = "./tests/modules/setup" } } run "service_policy" { command = plan variables { required_service_policies = "allow-vpn-ip-demo-sp" } # Check that a required Service Policy is inherited from the # namespace if the Load Balancer is advertised on the public # network and the origin server is behind a CE assert { condition = ( module.http-lb.app_lb_default_vip == false ? true : module.origin.private_origin == false ? true : (module.http-lb.app_lb_ns_service_policies == false ? true : contains(flatten(run.global_setup.xc_active_sp), var.required_service_policies)) ) error_message = "Service Policy \"${var.required_service_policies}\" must be associated with Load Balancer ${module.http-lb.app_lb_name} or inherited from the namespace." } # Check that a required Service Policy is applied directly to the # Load Balancer if it is advertised on the public network and the # origin server is behind a CE assert { condition = ( module.http-lb.app_lb_default_vip == false ? true : module.origin.private_origin == false ? true : (module.http-lb.app_lb_ns_service_policies == true ? true : contains(flatten(module.http-lb.app_lb_active_service_policies), var.required_service_policies)) ) error_message = "Service Policy \"${var.required_service_policies}\" must be explicitly associated with Load Balancer ${module.http-lb.app_lb_name} or inherited from the namespace." } } run "app_firewall" { command = plan # Check that an App Firewall policy is applied to the HTTP Load # Balancer if it is advertised on the public network assert { condition = module.http-lb.app_lb_default_vip == false ? true : length(module.http-lb.app_lb_app_firewall) > 0 error_message = "An App Firewall must be associated with Load Balancer ${module.http-lb.app_lb_name} if advertised on Internet " } } run "http_load_balancer_name" { command = plan # Check that the Load Balancer name is correct assert { condition = can(regex("^[a-z]([-a-z0-9]*[a-z0-9])?$", local.http-lb-name)) && length(local.http-lb-name) <= 63 error_message = "The resource name must be a valid DNS-1035 label: 1-63 lower-case alphanumeric characters or '-', starting with a letter and ending with an alphanumeric character." } } run "quota_usage" { command = plan # Check that the HTTP Load Balancer quota is not exceeded assert { condition = run.global_setup.xc_quota_usage["HTTP"] <= 200 error_message = "HTTP Load Balancer quota exceeded" } } The assert blocks within each run block define conditions that must evaluate to true for the test to pass. Running the tests 1. Initialize Terraform configuration. To run the tests, the Terraform workspace needs to be initialized to configure the backend and install all providers and modules referred to in the configuration (main and test): 2. Running the initial test When the terraform test command is executed, it scans the current root directory ./ and the subdirectory ./tests/ for files with .tftest.hcl or tftest.json extensions. To overwrite the default discovery behavior, the following command line flags can be used: Behavior Flag Example Change the testing directory test -test-directory terraform test -test-directory=integration-tests Run a specific test file filter terraform test -filter=tests/validation.tftest.hcl This is the main tfvars file, used to validate the run blocks { "tenant": "<tenant_id>", "api_url": "https://<tenant_name>.console.ves.volterra.io/api", "api_p12_file": "./certs/api_credential.p12", "f5-xc_cert": "./certs/xc.crt", "f5-xc_key": "./certs/xc.key", "base": "demo-app", "namespace": "demo", "domains": ["demo-app.demo.net"], "origin_servers": [ { "origin": "1.2.3.4", "site": "", "virtual_site": "onprem-demo-vs", "network": "inside" }, { "origin": "5.6.7.8", "site": "", "virtual_site": "onprem-demo-vs", "network": "outside" } ], "environment": "prod", "waf_policy": true, "service_policy": [ { "name": "allow-vpn-ip-demo-sp", "namespace": "shared" }, { "name": "allowed-sources-demo-sp", "namespace": "demo" } ], "origin_pool_port": 80, "use_tls": false } When all the assertions in the execution block pass, the test is considered successful 3. Validation of assertions 3.1. Unit testing To perform unit testing, the tests can be executed using the command = plan attribute. Setting the command to plan forces Terraform to only generate an execution plan and validate your configuration logic without creating real cloud resources, making the process fast and safe. Example 1: The required Service Policy is not active in the namespace, the Load Balancer is configured with the default setting to apply namespace policies, it is advertised on the public network, and the origin server is behind a CE. Service Policy "allow-vpn-ip-demo-sp" service policy is not in the namespace Active Service Policies: Example 2: The required Service Policy is not associated with the Load Balancer when a specific list of Service Policies is applied, it is advertised on the public network, and the origin server is behind a CE. Service Policy "allow-vpn-ip-demo-sp" service policy is removed from the tfvars file: Example 3: Verify that an App Firewall policy is applied to the HTTP Load Balancer if it is advertised on the public network. To force this test to fail, the waf_policy variable is set to false in the tfvars file: Example 4: Verify that the HTTP load balancer name conforms with the core RFC DNS 1035 rules. To force this test to fail, a period is added to the base variables in terraform.tfvars.json: Example 5: Verify that the HTTP load balancer quota has not been exceeded. To force this test to fail, a value lower than the current quota is added to the condition: 3.2. Integration testing To perform integration tests, we can run them using the command = apply attribute. By setting the command as apply, Terraform provisions real infrastructure, runs the assertions against the live resources and then automatically destroys them. Example: The required Service Policy is not active in the namespace, the Load Balancer is configured with the default setting to apply namespace policies, it is advertised on the public network, and the origin server is behind a CE. Service Policy "allow-vpn-ip-demo-sp" service policy is not in the namespace Active Service Policies: The ephemeral resources are created: The audit log entries record the creation and deletion of resources: Conclusion The native terraform test framework offers a secure and unified way to validate F5 Distributed Cloud Services Infrastructure by operating against test-specific, short-lived resources. This lets you detect breaking changes early and use the assertions as built-in guardrails, ensuring infrastructure code quality without complex external dependencies.196Views0likes0CommentsF5 rSeries: Next-Generation Fully Automatable Hardware
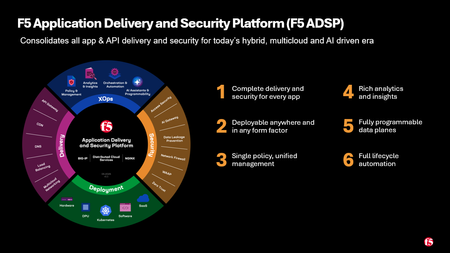
What is rSeries? F5 rSeries is a rearchitected, next-generation hardware platform that scales application delivery performance and automates application services to address many of today’s most critical business challenges. F5 rSeries is a key component of the F5 Application Delivery and Security Platform (ADSP). The additional benefit of automation capabilities can greatly simplify the process of deploying F5 products. A significant amount of time and resources are saved due to automation, which translates to more time to perform critical tasks. F5OS rSeries UI Demo Video Why is this important? Get more done in less time by using a highly automatable hardware platform that can deploy software solutions in seconds, not minutes or hours. Increased performance improves ROI: The rSeries platform is a high performance and highly scalable appliance with improved processing power. Running multiple versions on the same platform allows for more flexibility than previously possible. Pay-as-you-Grow licensing options that unlock more CPU resources. Key rSeries Use-Cases NetOps Automation Shorten time to market by automating network operations and offering cloud like orchestration with full stack programmability Drive app development and delivery with self-service and faster response time Business Continuity Drive consistent policies across on-prem and public cloud and across hardware and software based ADCs Build resiliency with rSeries’ superior performance and failover capabilities Future proof investments by running multiple versions of apps side-by-side; migrate applications at your own pace Cloud Migration On-Ramp Accelerate cloud strategy by adopting cloud operating models and on-demand scalability with rSeries and use that as on ramp to cloud Dramatically reduce TCO with rSeries systems; extend commercial models to migrate from hardware to software or as applications move to cloud Automation Capabilities Declarative APIs and integration with automation frameworks (Terraform, Ansible) greatly simplifies operations and reduces overhead: AS3 (Application Services 3 Extension): A declarative API that simplifies the configuration of application services. With AS3, customers can deploy and manage configurations consistently across environments. Ansible Automation: Prebuilt Ansible modules for rSeries enable automated provisioning, configuration, and updates, reducing manual effort and minimizing errors. Terraform: Organizations leveraging Infrastructure as Code (IaC) can use Terraform to define and automate the deployment of rSeries appliances and associated configurations. Example json file: Example of running the Automation Playbook: Example of the results: More information on Automation: Automating F5OS on rSeries GitHub Automation Repository Specialized Hardware Performance rSeries offers more hardware-accelerated performance capabilities with more FPGA chipsets that are more tightly integrated with TMOS. It also includes the latest Intel processing capabilities. This enhances the following: SSL and compression offload L4 offload for higher performance and reduced load on software Hardware-accelerated SYN flood protection Hardware-based protection from more than 100 types of denial-of-service (DoS) attacks Support for F5 Intelligence Services Conclusion The F5 rSeries platform addresses the modern enterprise’s need for high-performance, scalable, and efficient application delivery and security solutions. By combining cutting-edge hardware capabilities with robust automation tools and flexible migration options, rSeries empowers organizations to seamlessly transition from legacy platforms while unlocking new levels of performance and operational agility. Whether driven by the need for increased throughput, advanced multi-tenancy, the rSeries platform stands as a future-ready solution for securing and optimizing application delivery in an increasingly complex IT landscape. Related Content Cloud Docs rSeries Guide F5 rSeries Appliance Datasheet F5 VELOS: A Next-Generation Fully Automatable Platform DEMO: The Next Generation of F5 Hardware is Ready for you 1.8KViews2likes0Comments
Automating F5 ADSP — Part 4: F5 XC and NGINX Gateway Fabric for Delivery and Security
What this use case demonstrates This use case deploys NGINX Gateway Fabric (NGF) on the Kubernetes Gateway API as the in-cluster data plane. WAF and API protection are provided by F5 Distributed Cloud (XC) at the edge. It covers all four ADSP areas: Delivery, Security, Deployment, and xOps. Delivery: F5 Distributed Cloud HTTP load balancer at the edge, NGF (running NGINX Plus) handling in-cluster delivery via the Gateway API. Security: XC WAF in blocking mode, XC API protection built from an OpenAPI spec, with validation and fall-through both in report mode by default. Deployment: XC consumed as SaaS, GKE Standard with private nodes, NGF installed via OCI Helm chart, the application deployed via a separate OCI Helm chart and exposed through a Gateway API HTTPRoute. xOps: The OpenAPI spec lives in the repo at config/uc4/app/oas/openapi.json. The OAS is the source of truth for API protection policy, change the spec, push, and enforcement follows. Architecture What gets deployed: A GCP VPC with a dedicated k8s subnet (with secondary ranges for pods and services), management subnet, and NAT for private nodes A GKE Standard zonal cluster with private nodes and a control plane locked down by authorized networks NGINX Gateway Fabric running NGINX Plus, installed from oci://ghcr.io/nginx/charts/nginx-gateway-fabric. The NGF control plane provisions a data plane Deployment and a LoadBalancer Service when the Gateway is created. Comfy Capybara deployed via oci://ghcr.io/knowbase/charts/comfy-capybara, exposed through a Gateway API HTTPRoute attached to the NGF Gateway An F5 Distributed Cloud HTTP load balancer with WAF and API protection. The origin pool is resolved from the NGF data plane LoadBalancer IP via Terraform remote state. The HTTPRoute splits traffic two ways: /api to the API service with a URL rewrite that strips the prefix, / to the frontend. DevSecOps in practice for UC4 The lead-in covers the approach. For UC4, that means: Terraform handles infrastructure, the GKE cluster, NGF, the application Helm release, and all F5 Distributed Cloud objects. No click-ops. State lives in a GCS bucket the workflow creates on the first run, with a separate state file per module. The XC origin pool reads the NGF data plane LoadBalancer IP from state/uc4/ngf, so no IP is ever pasted between configs. GitHub Actions runs the pipeline. Branch names trigger deployments, so git history shows what was meant to happen. GCP Workload Identity Federation replaces static service account keys. The XC API certificate, NGINX Plus JWT, and NGINX registry credentials live in GitHub Actions secrets, not the repo. The OpenAPI spec at config/uc4/app/oas/openapi.json is the source of truth for API protection. The workflow uploads it to the XC object store and binds it to the API definition. The pipeline Pushing to a branch runs the workflow. There is no manual terraform apply or helm install. Action Branch Validate, plan, and apply deploy-adsp-uc4 Validate only (no apply) test-adsp-uc4 Destroy all resources destroy-adsp-uc4 Modules deploy sequentially: state bucket - infra - GKE - NGF - app - XC. Destroy runs in reverse. What's in the repo f5devcentral/F5-ADSP-Automation: Directory Purpose infra/gcp/ VPC, subnets with pod/service secondary ranges, NAT, firewall k8s/gcp/ GKE Standard cluster and node pool f5/ngf/gcp/ NGINX Gateway Fabric, Gateway API CRDs, Gateway, secrets f5/xc/ F5 Distributed Cloud HTTP LB, WAF, API definition (shared with other XC use cases) app/gcp/ Comfy Capybara Helm release and HTTPRoute config/uc4/gcp/env.json GCP, GKE, and NGF config config/uc4/app/env.json Application chart and route config config/uc4/app/oas/openapi.json OpenAPI spec the XC API definition is built from config/uc4/xc/env.json XC tenant, LoadBalancer, WAF and API feature flags .github/workflows/ CI/CD workflows Prerequisites, secrets, and troubleshooting are in the UC4 deployment guide. Demo Try it Fork f5devcentral/F5-ADSP-Automation, set the secrets and tfvars from the deployment guide, and push to deploy-adsp-uc4. Push to destroy-adsp-uc4 to tear it down. Contribute Issues and PRs welcome at f5devcentral/F5-ADSP-Automation. ADSP Architecture Article Series: Automating F5 ADSP Deployments (Intro) Automating F5 ADSP Deployments (Part 1 - F5 XC WAF and BIG-IP Adv. WAF) Automating F5 ADSP Deployments (Part 2 - F5 XC API Security and NGINX Ingress & App Protect) Automating F5 ADSP Deployments (Part 3 - F5 XC API Protection and NGINX Ingress) Automating F5 ADSP Deployments (Part 4 - F5 XC API Security and NGINX Gateway Fabric) Automating F5 ADSP Deployments (Part 5 - F5 XC, BIG-IP APM, CIS, and NGINX Ingress) Minimizing Security Complexity: Managing Distributed WAF Policies 100Views1like0Comments
Automating F5 ADSP — Part 2: F5 XC and NGINX for Delivery and Security
What this use case demonstrates This use case deploys NGINX Ingress Controller (NIC) running NGINX Plus with NGINX App Protect V5 (NAP V5) as the in-cluster data plane on GKE. WAF runs on two layers: NAP V5 enforcing inside the cluster, F5 Distributed Cloud (XC) enforcing at the edge. XC also provides API discovery and protection driven by an OpenAPI spec. It covers all four ADSP areas: Delivery, Security, Deployment, and xOps. Delivery: F5 Distributed Cloud HTTPS load balancer at the edge, NGINX Ingress Controller handling in-cluster delivery through the NIC VirtualServer CRD. Security: Two layers of WAF. NAP V5 runs as NIC sidecars (waf-enforcer and waf-config-mgr) and enforces the WAF policy attached to the VirtualServer. XC WAF runs at the edge in blocking mode. XC API protection is driven by an OpenAPI spec. Deployment: XC consumed as SaaS, GKE Standard with private nodes, NIC and NAP installed via OCI Helm chart, the application installed via a separate OCI Helm chart. xOps: NAP policy lives in config/uc2/nap/policy.json. The workflow compiles it with the NAP waf-compiler container, uploads the compiled bundle to GCS, and NIC mounts the bundle read-only via the GCS Fuse CSI driver. The waf-config-mgr sidecar watches the mount and pushes updates to the waf-enforcer. Change the policy, push, and NAP follows. Architecture What gets deployed: A GCP VPC with a dedicated k8s subnet (with secondary ranges for pods and services), management subnet, and NAT for private nodes A GKE Standard zonal cluster with private nodes and a control plane locked down by authorized networks NGINX Ingress Controller running NGINX Plus, with NAP V5 enforcer and config-mgr sidecars Comfy Capybara deployed via an OCI Helm chart, exposed through a NIC VirtualServer that references the waf-policy CRD in the nginx-ingress namespace An F5 Distributed Cloud HTTP load balancer with WAF and API protection. The origin pool is resolved from the NIC LoadBalancer IP via Terraform remote state. The VirtualServer attaches waf-policy both server-wide and on the /api route by default, so the policy enforces everywhere as a baseline. DevSecOps in practice for UC2 The lead-in covers the approach. For UC2, that means: Terraform handles infrastructure, the GKE cluster, NIC and NAP, the application Helm release, and all F5 Distributed Cloud objects. No click-ops. State lives in a GCS bucket the workflow creates on the first run, with a separate state file per module. The same bucket carries the compiled NAP policy bundle that NIC mounts via the GCS Fuse CSI driver. The XC origin pool reads the NIC LoadBalancer IP from state/uc2/nic, so no IP is pasted between configs. GitHub Actions runs the pipeline. Branch names trigger deployments, so git history shows what was meant to happen. GCP Workload Identity Federation replaces static service account keys for the runner. NIC pods also use Workload Identity to impersonate the runtime service account when mounting the NAP bundle from GCS. The XC API certificate, NGINX Plus JWT, and NGINX registry credentials live in GitHub Actions secrets, not the repo. The OpenAPI spec at config/uc2/app/oas/openapi.json is base64-encoded by the workflow and referenced inline by the XC API definition. Change the spec, push, and API protection follows. The pipeline Pushing to a branch runs the workflow. There is no manual terraform apply or helm install. Action Branch Validate, plan, and apply deploy-adsp-uc2 Validate only (no apply) test-adsp-uc2 Destroy all resources destroy-adsp-uc2 Modules deploy sequentially: state bucket - infra - GKE - compile NAP policy - NIC and NAP - app - XC. Destroy runs in reverse. What's in the repo f5devcentral/F5-ADSP-Automation: Directory Purpose infra/gcp/ VPC, subnets with pod and service secondary ranges, NAT, firewall k8s/gcp/ GKE Standard cluster and node pool f5/nic/gcp/ NGINX Ingress Controller and NAP V5 Helm release f5/xc/ F5 Distributed Cloud HTTP LB, WAF, API definition (shared with other XC use cases) app/gcp/ Comfy Capybara Helm release and VirtualServer config/uc2/gcp/env.json GCP, GKE, and NIC config config/uc2/nap/policy.json NAP policy source, compiled in the workflow config/uc2/app/env.json Application chart and VirtualServer config config/uc2/app/oas/openapi.json OpenAPI spec the XC API definition is built from config/uc2/xc/env.json XC tenant, LoadBalancer, WAF and API feature flags .github/workflows/ CI/CD workflows Prerequisites, secrets, and troubleshooting are in the UC2 deployment guide. Demo Try it Fork f5devcentral/F5-ADSP-Automation, set the secrets and tfvars from the deployment guide, and push to deploy-adsp-uc2. Push to destroy-adsp-uc2 to tear it down. Contribute Issues and PRs welcome at f5devcentral/F5-ADSP-Automation. Resources: F5 Application Delivery and Security Platform GitHub Repo and Automation Guide ADSP Architecture Article Series: Automating F5 ADSP Deployments (Intro) Automating F5 ADSP Deployments (Part 1 - F5 XC WAF and BIG-IP Adv. WAF) Automating F5 ADSP Deployments (Part 2 - F5 XC API Security and NGINX Ingress & App Protect) Automating F5 ADSP Deployments (Part 3 - F5 XC API Protection and NGINX Ingress) Automating F5 ADSP Deployments (Part 4 - F5 XC API Security and NGINX Gateway Fabric) Automating F5 ADSP Deployments (Part 5 - F5 XC, BIG-IP APM, CIS, and NGINX Ingress) Minimizing Security Complexity: Managing Distributed WAF Policies 176Views3likes0Comments
Automating F5 ADSP — Part 1: F5 XC and BIG-IP for Delivery and Security
What this use case demonstrates This use case covers three of the four ADSP areas: Delivery, Security, and Deployment. Delivery — F5 Distributed Cloud (XC) load balancer at the edge, F5 BIG-IP LTM handling traffic management inside the VPC. Security — XC WAF at the edge, BIG-IP Advanced WAF (AWAF) applying in-path policy before traffic reaches the application servers. Deployment — XC consumed as SaaS, BIG-IP deployed as a Virtual Edition in GCP. Same article, two deployment models, both provisioned from code. You get two layers of delivery and two layers of WAF, across a SaaS edge and a self-managed VE. The whole stack, VPC through XC load balancer, comes up from a single git push. Architecture What gets deployed: A GCP VPC with management, external, internal, and application subnets BIG-IP with AWAF in a single-NIC configuration OWASP Juice Shop and crAPI as target applications F5 Distributed Cloud HTTP load balancer, origin pool, and WAF policy pointing at the BIG-IP The vulnerabilities in the apps are deliberate. They let you exercise the WAF stack against real attack signatures and API abuse patterns. Without them, you only know the controls deployed, not that they work. DevSecOps in practice The lead-in covers the approach. For UC1, that means: Terraform handles infrastructure, BIG-IP configuration, and F5 Distributed Cloud objects. No click-ops. State lives in a GCS bucket the workflow creates on the first run, with a separate state file per module. The same bucket carries the AS3 declaration BIG-IP pulls on boot, so the runner never needs network access to BIG-IP. GitHub Actions runs the pipeline. Branch names trigger deployments, so git history shows what was meant to happen. GCP Workload Identity Federation replaces static service account keys. The F5 XC API certificate lives in GitHub Actions secrets, not the repo. The pipeline Pushing to a branch runs the workflow. There is no manual terraform to apply. Action Branch Validate, plan, and apply deploy-adsp-uc1 Validate only (no apply) test-adsp-uc1 Destroy all resources destroy-adsp-uc1 This keeps intent visible in git, makes destroy as easy as deploying, and gives reviewers a real PR to look at when something changes. What's in the repo f5devcentral/F5-ADSP-Automation: Directory Purpose infra/gcp/ VPC, subnets, firewall rules compute/gcp/ Juice Shop and crAPI f5/ BIG-IP base config and AWAF policy config/uc1/gcp/env.json GCP project, region, prefix config/uc1/xc/env.json F5 Distributed Cloud config .github/workflows/ CI/CD workflows Demo Try it Prerequisites, secrets, and troubleshooting are in the Use Case Deployment Guide. Contribute Issues and PRs welcome at f5devcentral/F5-ADSP-Automation/Issues. Resources: F5 Application Delivery and Security Platform GitHub Repo and Automation Guide ADSP Architecture Article Series: Automating F5 ADSP Deployments (Intro) Automating F5 ADSP Deployments (Part 1 - F5 XC WAF and BIG-IP Adv. WAF) Automating F5 ADSP Deployments (Part 2 - F5 XC WAF and NGINX App Protect) Automating F5 ADSP Deployments (Part 3 - F5 XC API Protection and NGINX Ingress) Automating F5 ADSP Deployments (Part 4 - F5 XC API Security and NGINX Gateway Fabric) Automating F5 ADSP Deployments (Part 5 - F5 XC, BIG-IP APM, CIS, and NGINX Ingress) Minimizing Security Complexity: Managing Distributed WAF Policies 316Views1like0Comments
Automating F5 Application Delivery and Security Platform Deployments
The F5 ADSP Architecture Automation Project The F5 Application Delivery and Security Platform (ADSP) reduces the complexity of modern applications by integrating operations, traffic management, performance optimization, and security controls into a single platform with multiple deployment options. This series outlines practical steps anyone can take to put these ideas into practice using the F5 ADSP Architectures GitHub repo and related projects. Each article in the series highlights a different deployment example. The examples can be run locally or integrated into CI/CD pipelines following DevSecOps practices. The repositories are community-supported and intended as reference code for demos, workshops, or as a stepping stone for your own F5 ADSP deployments. If you find any bugs or have any enhancement requests, open an issue, or better yet, contribute. The F5 Application Delivery and Security Platform (F5 ADSP) F5 ADSP addresses four core areas: how you operate day-to-day, how you deploy at scale, how you secure against evolving threats, and how you deliver reliably across environments. Each comes with its own challenges, but together they define the foundation for keeping systems fast, stable, and safe. xOps — day-to-day operations, observability, and lifecycle management Deployment — getting workloads where they need to go, at the scale they need Delivery — traffic management across hybrid and multi-cloud environments Security — protecting applications and APIs from current threats Each architecture deployment example in this series is designed to cover at least three of the four core areas. This ensures the examples demonstrate how multiple components of the platform work together in practice, rather than showcasing any single feature in isolation. DevSecOps: Integrating security into the software delivery lifecycle is a necessary part of building and maintaining secure applications. This project incorporates DevSecOps practices by using supported APIs and tooling, with each use case including a GitHub repository containing IaC code, CI/CD integration examples, and telemetry options. In practice across the series, that means Terraform for infrastructure and F5 configuration, GitHub Actions as the pipeline runner, federated cloud identity instead of long lived keys, secrets handled through the platform rather than committed, and vulnerable target applications so the security controls can be exercised end-to-end. Contribute The repos are community-supported. Open an issue, send a PR, or port a use case to another cloud. Resources: F5 Application Delivery and Security Platform GitHub Repo and Automation Guide ADSP Architecture Article Series: Automating F5 ADSP Deployments (Intro) Automating F5 ADSP Deployments (Part 1 - F5 XC WAF and BIG-IP Adv. WAF) Automating F5 ADSP Deployments (Part 2 - F5 XC WAF and NGINX App Protect) Automating F5 ADSP Deployments (Part 3 - F5 XC API Protection and NGINX Ingress) Automating F5 ADSP Deployments (Part 4 - F5 XC API Security and NGINX Gateway Fabric) Automating F5 ADSP Deployments (Part 5 - F5 XC, BIG-IP APM, CIS, and NGINX Ingress) Minimizing Security Complexity: Managing Distributed WAF Policies831Views3likes0Commentslog local0. is not a debugging strategy!
But let's be honest...with iRules, it's pretty much all we've had. If you have ever debugged an iRule, you know the ritual. Former F5er Jibin_Han in an article once called the log command is "the crudest of debug facilities." He was not wrong. It is the printf of application delivery, and at high traffic the logging pipeline will happily truncate your output just to keep things spicy. So back in TMOS 13.1, he shipped something much better: ltm rule-profiler. It is a passive tracer baked right into TMM. (Did you know this? Most don't, including most F5ers I talk to!) You do not touch your script. You tell it which virtual server, events, and occurrences to watch, you flip it on, and it emits a timestamped execution trace of everything your iRule did. Events firing, rules matching, the Tcl VM grinding through bytecode, native commands getting dispatched, variables changing. The whole shebang. There is just one catch. Ok actually two. It is tmsh-only. No GUI, no REST endpoint, no nothing. You configure it by hand and you start and stop it by hand. The not so fun part, the output looks like this: 1780079189187194,RP_EVENT_ENTRY,/Common/testvip-http,CLIENT_ACCEPTED,22623,0x70373707000576,10.1.10.6,36086,0,10.1.10.50,80,0 1780079189187210,RP_RULE_ENTRY,/Common/testvip-http,/Common/myrule,22623,0x70373707000576,... 1780079189187225,RP_RULE_VM_ENTRY,... 1780079189187240,RP_CMD_BYTECODE,/Common/testvip-http,push1,... Now multiply that by a few hundred lines, sprinkle in microsecond timestamps you are expected to subtract in your head, and remember that every single custom iRules command is actually a round trip out of the Tcl VM and back into TMM. A command, inside a VM, inside the microkernel. We need to go deeper. Reading it raw is less "performance analysis" and more "staring at the green rain in The Matrix and pretending you can see the woman in the red dress." The data is genuinely great. It's just wearing a CSV trench coat and refusing to make eye contact. But that ends now. Let's talk about Rültracer. What Rültracer is Rültracer is an iApps LX extension that gives ltm rule-profiler the face it always deserved. When Jibin_Han released his 3-part article series (linked at the bottom of this article) introducing the rule-profiler, we had a couple interns who built an analysis engine called Campfire that used a perl-based flamegraph package to display the trace in context of the "lift" of each occurence within a trace. The challenge was you had to manually configure everything on BIG-IP, send the logs somewhere, collect those logs, then import them into where you built campfire to run. A lot of manual work to get to the good. But Rültracer? It runs on the BIG-IP. An on-box Node worker handles the unglamorous parts: it configures the profiler, sets up (and tears down) the log publisher, captures the trace stream into a per-session file, and serves that file to a browser app. The browser does all the parsing and visualization client side, so the box just ships raw CSV and gets out of the way. What you get: A sequence diagram and step-through debugger. The trace becomes a UML-style sequence diagram across six lifelines (Users, Event, Rule, Rule VM, Command VM, Command), with the TMM and Tcl VM sides color coded so you can actually see every handoff between the microkernel and the interpreter. Which matters, because that back-and-forth is exactly where iRule inefficiency likes to hide. Next to it sits a linked step-through with a timeline scrubber, variable state, and command replay. Click the diagram, the table follows. Click the table, the diagram follows. There's a Tclsh disassembler you can enable as well, and as long as you're willing to modify the parts of the iRules code under test. I wrote an article years ago on this disassembly functionality, it's worth the read to see what this functionality affords you. iRule source mapping. It pulls your actual iRule source and lights it up: which commands fired (with microseconds and counts), which branches never ran, and which lines were ambiguous multi-matches. Your code, annotated by what the trace really did. (this part is early stages, it needs work.) Flamegraphs, with diff. An interactive flamegraph where width equals inclusive time, so the widest frame is your prime suspect. Find the slow command without playing Where's Waldo. Captured a "before" and an "after"? The diff view paints frames red and blue by how their self-time shifted, so you can prove your optimization actually optimized. Cycles versus CPU. Rültracer takes the box's own ltm rule stats hardware cycle counters and turns them into honest performance tables: cycles to microseconds, percent of a CPU per request, and max requests per second before your iRule becomes the bottleneck. It even reconciles the authoritative cycle counts against the trace-derived numbers, and the gap between them is the profiler's own overhead. These are numbers you can bring to a capacity-planning meeting without getting laughed out of the room. This is based on Deb Allen's yesteryear work in excel for computing capacity with iRules and my update in doing this with python much later. Reports and exports. Export a capture as self-contained HTML, JSON, a Mermaid sequence diagram, or Brendan Gregg folded stacks. Share it, attach it to a ticket, or feed it to your own tooling. Multi-TMM aware. Captures that span multiple TMMs get partitioned by context id with a scope selector, because of course your traffic did not politely land on a single TMM. No (post RPM install) build steps, no cloud, no telemetry, no agent. Vanilla JS in the browser, a small ES5 worker on the box, fully self-contained. And it is a lab tool on purpose: tracing adds significant TMM overhead, so this is not something you run in production. Rültracer tears the profiler and publisher down for you on teardown, so you never accidentally leave the tap open. Installing it Rültracer installs over SSH. You build the RPM on your workstation, copy it to the BIG-IP, and run the installer on the box as root. The installer provisions the persistent data directory, installs the package through the iApps LX framework, runs the post-install step, and confirms the workers came up. Replace and with your BIG-IP's SSH host and port. If it answers on plain old port 22, drop the -P / -p flags. First time on a fresh box The installer script lives outside the RPM, so it rides along once: Copy the installer on the box (one time only) scp -O -P <port> build/install-onbox.sh root@<host>:/shared/images/ Build, ship, and install ./build/build-rpm.sh 0.7.1 0001 scp -O -P <port> build/dist/rultracer-0.7.1-0001.noarch.rpm root@<host>:/shared/images/ ssh -p <port> root@<host> /shared/images/install-onbox.sh 0.7.1-0001 Because the installer runs as root, it creates the session data directory owned by the restnoded worker user before the workers start (the worker is uid 198 and cannot create directories under /shared/ on its own). When it finishes, it prints your UI URL: https://BIG-IP-host/mgmt/shared/rultracer/ui/ Open that, and you are in. Follow-on updates The installer is already on the box, so the next rounds are just bump, build, ship, install like above. That is an in-place upgrade and it keeps your saved sessions. If you ever want a clean slate, pass --reinstall, but note it wipes session data, so hit the Sessions tab's "Download backup" button first if you care about what is in there. See it in action (The walkthrough covers a live capture end to end: pointing the profiler at a virtual server, driving a little traffic, then digging through the sequence diagram, flamegraph, and cycle stats on a real trace.) Conclusion This was a fun project to bring together something I've played with a lot since the v13.1 release but could never quite figure out a packaging solution to make it functional enough to rely on. You can find the code in the Rültracer repo on Github. Let me know in the comments if you take a look at this and submit any bugs ore feature requests as an issue out on Github. 299Views2likes0Comments