NGINXaaS for Azure
2 TopicsUnlocking Insights: Enhancing Observability in F5 NGINXaaS for Azure for Optimal Operations
Introduction To understand application performance, you need more than just regular health checks. You need to look at the system’s behavior, how users use it, and find possible slowdowns before they become big problems. By using F5 NGINXaaS for Azure, organizations can gain enhanced visibility into their backend applications through extensive metrics, API (access) logs, and operational logs within Azure environments. This proactive approach helps prevent minor issues from developing into major challenges while optimizing resource efficiency. This technical guide highlights advanced observability techniques and demonstrates how organizations can leverage F5 NGINXaaS to create robust, high-performing application delivery solutions that ensure seamless and responsive user experiences. Benefits of F5 NGINX as a Service F5 NGINXaaS for Azure provides robust integration with ecosystem tools designed to monitor and analyze application health and performance. It uses rich telemetry from granular metrics across various protocols, including HTTP, TLS, TCP, and UDP. For technical experts overseeing deployments in Azure, this service delivers valuable insights that facilitate more effective troubleshooting and optimize workflows for streamlined operations. Key advantages of F5 NGINXaaS include access to over 200 detailed health and performance metrics that are critical for ensuring application stability, scalability, and efficiency. Please refer to the documentation for detailed information to learn more about the available metrics. There are two ways to monitor metrics in F5 NGINXaaS for Azure, providing flexibility in how you can track the health and performance of your applications: Azure Monitoring Integration for F5 NGINXaaS: An Azure-native solution delivering detailed analytical reports and customizable alerts. Grafana Dashboard Support: A visualization tool specifically designed to provide real-time, actionable insights into system health and performance. Dive Deep with Azure Monitoring for F5 NGINXaaS Azure Monitoring integration with F5 NGINXaaS provides a comprehensive observability solution tailored to dynamic cloud environments, equipping teams with the tools to enhance application performance and reliability. A crucial aspect of this solution is the integration of F5 NGINXaaS access and error logs, which offers insights essential for troubleshooting and resolving issues effectively. By combining these logs with deep insights into application and performance metrics such as request throughput, latency, error rates, and resource utilization, technical teams can make informed decisions to optimize their applications. Key Features Include: Advanced Analytics: Explore detailed traffic patterns and usage trends to better understand application load dynamics. This allows teams to fine-tune configurations and improve performance based on actual user activity. Customizable Alerts: Set specific thresholds for key performance indicators to receive immediate notifications about anomalies, such as unexpected spikes in 5xx error rates or latency challenges. This proactive approach empowers teams to resolve incidents swiftly and minimize their impact. Detailed Metrics: Utilize comprehensive metrics encompassing connection counts, active connections, and request processing times. These insights facilitate better resource allocation and more efficient traffic management. Logs Integration: Access and analyze F5 NGINXaaS logs alongside performance metrics, providing a holistic view of application behavior. This integration is vital for troubleshooting, enabling teams to correlate log data with observability insights for effective issue identification and resolution. Scalability Insights: Monitor real-time resource allocation and consumption. Predict growth challenges and optimize scaling decisions to ensure your F5 NGINXaaS service deployments can handle variable client load effectively. By integrating Azure Monitoring with F5 NGINXaaS, organizations can significantly enhance their resilience, swiftly tackle performance challenges, and ensure that their services consistently deliver outstanding user experiences. With actionable data at their fingertips, teams are well-positioned to achieve operational excellence and foster greater user satisfaction. Visualize Success with Native Azure Grafana Dashboard Enable the Grafana dashboard and import the F5 NGINXaaS metrics dashboard to take your monitoring capabilities to the next level. This dynamic integration provides a clear view of various performance metrics, allowing teams to make informed decisions backed by insightful data. Together, Azure Monitoring and the Grafana Dashboard form a strong alliance, creating a comprehensive observability solution that amplifies your application’s overall performance and reliability. The Grafana interface allows real-time querying of performance metrics, offering intuitive visual tools like graphs and charts that simplify complex data interpretation. With Azure Monitoring, Grafana builds a robust observability stack, ensuring proactive oversight and reactive diagnostics. Getting Started with NGINXaaS Azure Workshop We have curated self-paced workshops designed to help you effectively leverage the enhanced observability features of F5 NGINXaaS. These workshops provide valuable insights and hands-on experience, empowering you to develop robust observability in a self-directed learning environment. Azure monitoring lab workshop will enhance your skills in creating and analyzing access logs with NGINX. You’ll learn to develop a comprehensive log format, capturing essential details from backend servers. By the end, you'll be equipped to use Azure’s monitoring tools effectively, significantly contributing to your growth and success. In the Native Azure Grafana Dashboard workshop, you'll explore the integration of F5 NGINXaaS for Azure with Grafana for effective service monitoring. You'll create a dashboard to track essential metrics for your backend servers. This hands-on session will equip you with the skills to analyze real-time data and make informed decisions backed by valuable insights. Upon completing this lab exercise, you will have gained practical expertise in leveraging enhanced observability features of F5 NGINXaaS. You will be proficient in creating and analyzing access logs, ensuring you can effectively capture critical data from backend servers. Additionally, you will have developed the skills necessary to integrate F5 NGINXaaS with Grafana, allowing you to build a dynamic dashboard that tracks essential metrics in real-time. This hands-on experience will empower you to make informed decisions based on valuable insights, significantly enhancing your capabilities in monitoring and maintaining your applications. Conclusion By fully utilizing the observability features of F5 NGINXaaS, the organization can gain valuable insights that enhance performance and efficiency. With Azure Monitoring and Grafana working together, teams can manage proactively and make informed, data-driven decisions. This approach leads to smoother web experiences and improves operational performance. Interested in getting started with F5 NGINXaaS for Azure? You can find us on the Azure marketplace.31Views0likes0CommentsF5 NGINXaaS for Azure: Multi-Region Architecture
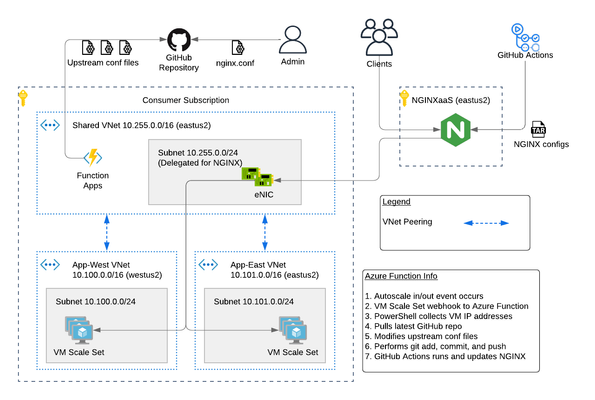
The F5 NGINXaaS for Azure offering recently announced general availability. Trust me...I've been using it and having fun! In this article, I will show you an example hub and spoke architecture using GitHub Actions and Azure Functions to automate NGINX configurations. As a bonus, I have code on GitHub that you can use to deploy this example. Topics Covered: NGINXaaS for Azure Architecture Explained The NGINXaaS for Azure architecture consists of an F5 subscription as well as customer subscription. F5 subscription - hidden from user, NGINX Plus instances, control plane, data plane Customer subscription - eNICs from VNet Injection, customer network stack, customer workloads F5 Subscription The NGINXaaS offering creates NGINX Plus instances and other related components like NGINX control plane and data plane resources in the F5 subscriptions. These items are not visible to the end user, and therefore result in the operational tasks of upgrades and scaling being managed by the NGINXaaS offering instead of the user. Each NGINX deployment, like other Azure services, is regional in nature. If you need to deploy NGINX closer to the client, then this will require multiple NGINX deployments (ex. westus2, eastus2). Each NGINX deployment will have a unique listener address. You can then use DNS to send clients to an NGINX deployment in the nearest region. Here is an example diagram. Customer Subscription The customer subscription has items like network stacks, Key Vaults, monitoring, application workloads, and more. The NGINX deployment automatically creates ethernet NICs (eNICs) in the customer subscription using VNet Injection and subnet delegation. The eNICs are deployed inside their own Azure Resource Group. They receive IP addressing from the customer VNet and are indeed visible by the user. However, there is no management needed with the eNICs because they are part of the NGINX deployment. Note: In my testing during public preview, I have noticed that Azure lets you manually remove subnet delegation for the NGINX service. Warning...do NOT do this. It will break traffic flow. Hub and Spoke Architecture You can easily make a hub and spoke design with NGINX in the mix using VNet peering. This is a great use case when required to use a shared NGINX deployment across different VNets, environments, or scaling workloads across multiple regions. Recall from earlier that an NGINX deployment will automatically create eNICs in the customer subscription. Therefore, you can control the entry point into the customer environment and the traffic flows. For example, configuring NGINX to use a customer shared VNet with peering gives you a hub and spoke design such as the picture below. This results in the NGINX eNICs being deployed into a customer Shared VNet (hub). Meanwhile the customer places workloads into their own VNets (spokes). Demo Code If this is the first time deploying NGINXaaS for Azure in your subscription, then you will need to subscribe to it in the marketplace. Search for “F5 NGINXaaS for Azure” in marketplace or follow this link Select F5 NGINXaaS for Azure and choose "Public Preview" and subscribe Time to play with code! Click the link below and review the README to deploy the demo example. There are prerequisites to follow. For example, you need to have a GitHub repository that stores the NGINX configuration files. You also need to have an Azure Key Vault and secret containing your GitHub access token. These are explained in the README. GitHub repo - F5 NGINXaaS for Azure Deployment with Demo Application in Multiple Regions After the deployment is done, you have a few options on how to handle NGINX configurations. I will share examples in future articles, but for now go ahead and explore on your own. Refer to the NGINXaaS for Azure documentation "NGINX Configuration" to get started. Summary This article gives an example architecture for deploying the NGINXaaS for Azure offering. I shared details on the different NGINX components, and I also shared demo code to help you explore the solution on your own! Contact us with any questions or requirements. We would love to hear from you! Resources DevCentral Series - F5 NGINXaaS for Azure F5 NGINXaaS for Azure Docs Blog Introducing F5 NGINXaaS for Azure3.4KViews6likes2Comments