Introducing TCP Analytics
I'm pleased to announce that F5® TMOS® 12.1 is the first release to contain our TCP Analytics package. If you would like to measure how well TCP is delivering application data, perform A/B testing, or get diagnostic help for slow data delivery, this tool is a new and powerful way to do those things. TCP Analytics works with virtual servers that use either a TCP profile or a FastL4 profile.

What stats are available?
We're collecting several different statistics, some of them conventional TCP metrics and some of them brand new concepts. BIG-IP collects statistics over five minute intervals and then reports them through our AVR (Application Visibility and Reporting) module.
- RTT Minimum, Mean, and Maximum measures the best-case, worst-case, and average delay (Round Trip Time, or RTT) experienced by packets. Although packet delay is meaningful to users in its own right, if the mean RTT is closer to maximum than minimum RTT, it's an indication router queues in the path are filling up. This congestion might be due to cross traffic, or caused by the profile settings on your BIG-IP.
- RTTVAR Mean is the mean value of the "RTT Variation," which is a concept defined in the TCP specification. RTT Variation is a close analogue of the statistical variance but is easier to compute. The RTTVAR is a measurement of the variation in delay, or "jitter", that your applications experience. High jitter can have all sorts of negative consequences, but is most damaging to streaming applications where sudden jumps in latency deliver packets too late given the amount of buffered audio or video.
- Goodput is the total amount of data delivered to the upper layer, which might be SSL, HTTP, or some other application. This is the aggregate goodput for the set of connections you choose to display, not the goodput experienced by a particular connection. In other words, if there are more connections there is usually more goodput. The definition of goodput specifically excludes data that TCP retransmits or cannot deliver due to gaps in received packets.
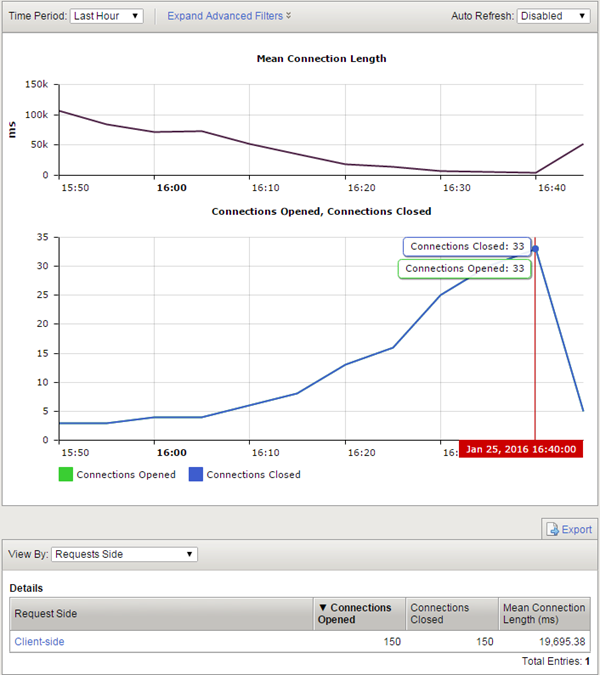
- Connections Opened and Closed; Packets Sent, Received, and Lost are self-explanatory. TCP Analytics measures lost packets by tracking packet retransmissions. In isolated cases, retransmissions turn out to be unnecessary, but Analytics will report the packet as lost anyway.
- Mean Connection Time measures the average time from completion of the three way handshake to the remote host's acknowledgment of the BIG-IP FIN flag, unless an iRule causes collection to start late or finish early.
- Delay State Analysis is an attempt to answer the question "why is my TCP so slow?". It divides the entire life of a TCP connection into a total of 10 states based on why the connection is sending (or, more accurately, not sending) data at any given time. By reporting the time connections spend in each state, users can immediately see what the principal causes of delay are. In some cases, users can easily address these causes by tuning their TCP profile. In other cases, the root cause is a client, the network path itself, or an application delay outside the scope of TCP. (Delay State Analysis is not available with FastL4 profiles.)
Aggregate stats aren't that useful to me. How can I look at specific sets of connections?
Many BIG-IPs deal with millions of connections at a time, so storing statistics for every connection individually uses a lot of memory. However, the AVR engine is designed to hash relevant connection attributes and attach it to its data storage, so that users can pull out statistics for particular subsets of data.
In the TCP Analytics profile you attach to a virtual, you decide what connection attributes you want to store. We don't track them all automatically, because in many cases a BIG-IP with many connections and storing all attributes will run into memory limitations and lose some attribute granularity.
The connection attributes available are virtual server, IP Address or /24 IP subnet address, nexthop MAC address, geolocation, and whether the connection is clientside or serverside.
In addition, you can use the power of iRules to be more selective. First of all, you can turn on and off statistics collection via iRule, meaning you can collect stats only for connections that meet specific conditions laid out in the iRule. Secondly, iRules can attach an arbitrary string as an attribute. In other words, you can create arbitrary connection categories based on any iRule logic you like, and then display separate statistics for those categories. For example, you could separate download connections out by file size and display the stats for them separately.
This is great. How do I get started?
There are four main steps:
1) Provision AVR on your BIG-IP under System > Resource Provisioning. If you are licensed for LTM, you are licensed for AVR.
2) Create a TCP Analytics Profile.
3) Attach the TCP Analytics Profile to one or more virtual servers.
4) Watch the stats come in!
There are many more details at the online help for the product.
Obviously, there are many nuances we could explore in this space. Based on your feedback, I may dive into those nuances in a future article. Until then, enjoy!
Help guide the future of your DevCentral Community!
What tools do you use to collaborate? (1min - anonymous)